Big Swiss Articles Compilation
11 Mar 2022
This is a compilation of 3 articles posted by price action trader Big Swiss on Mack website about price action fundamentals, momentum exploration, tick charts and top gun reversal bars.
Sources:
- Price Action Fundamentals and Momentum Exploration
- The Advantage of Tick Charts
- Top Gun – Reversal Bars
1. Price Action Fundamentals and Momentum Exploration
This is a guest article form another price action trader. Thanks to Big Swiss for his contributions.
This series of articles explores the foundations of Price Action and why it works. I also wanted to provide a framework for others to begin to understand and explore these aspects without having to be an expert.
With everything that is presented, I welcome you to consider what is written, review historical charts and live examples, and see if you arrive to the same conclusions (I believe you will). In short, do not take these aspects as absolute truth (as there are few things that are). However, if they result in you taking a fresh perspective and approach in attempting to understand the language, you may find yourself releasing incorrect presuppositions and obtaining a fresh view.
Some things may appear very obvious to you. Wonderful! Keep exploring those aspects as you can continue to build on your strengths.
Other things you may find are a bit perplexing. Hopefully some of these conversations can assist you in exploring those aspect further until you have a stronger sense. Where is the best place to find those answers? The market of course!!!
1.1 Setting the Table
First, Price Action is founded using three critical aspects: momentum, support, and resistance. Note, for every buyer there is a seller. This is so important that I’m going to repeat it in all capitals – FOR EVERY BUYER THERE IS A SELLER! Since the ES is an institutional market where the majority of the participants are institutions (large volume and resources), and the institutions trade using an edge, that means that each side believes that statistically they are making a logical, voluntary action.
You are not going to “fool them”. They are not after your money, and they are not targeting your stops. However, this concept yields a critical key to assist in training. If each participant is voluntarily taking an action to which they see benefit, then the resultant price movements within historical charts show exactly where support and resistance areas exist. If price stops moving upwards, it is because buyers are insufficient in strength at a specific price to result in absorbing all of the selling at a price level. The reverse also holds.
The most important implication from this is that it enables you to review historical charts and see where buying and selling pressure existed (support and resistance) logically. This type of studying will familiarize you with how markets move over different periods of volatility (high and low), as well as transitions between a variety of market cycles (trend, trading range, breakouts, extremes… ).
1.2 Price Bars, Momentum and Exploration
Each bar on a chart represents a price movement within a certain structure. For time charts, the x axis is time. For tick charts, it is number of trades.
Then, with the assumption that all price movement is logically based, a bar that begins on its low, and ends on its high is showing a positive bias in an upwards direction. If the bar is a very large bar, then the people who were buying throughout the bar period were much stronger than the sellers for that period. If the bull bar “closes on its high”, then the momentum is slightly stronger to continue in the same direction. Why? Because for that brief period of time the institutions buying at that price agreed that the price gave them an advantage (as many people may only trade long this allows for the justification). It would not have occurred otherwise because if there was not a buyer at that price, and there were sellers in the market, the price would have ticked down to find a buyer, which would have been at a lower price.
The implication is that a bar that does not close on its high or low is not as strong directionally. This is generally true and let’s explore this. Note, this also emphasizes why using good signal bars in trading can make all of the difference towards your bottom line because generally, at least for a brief period of time, there is a higher probability of the next tick to increment in the same direction.
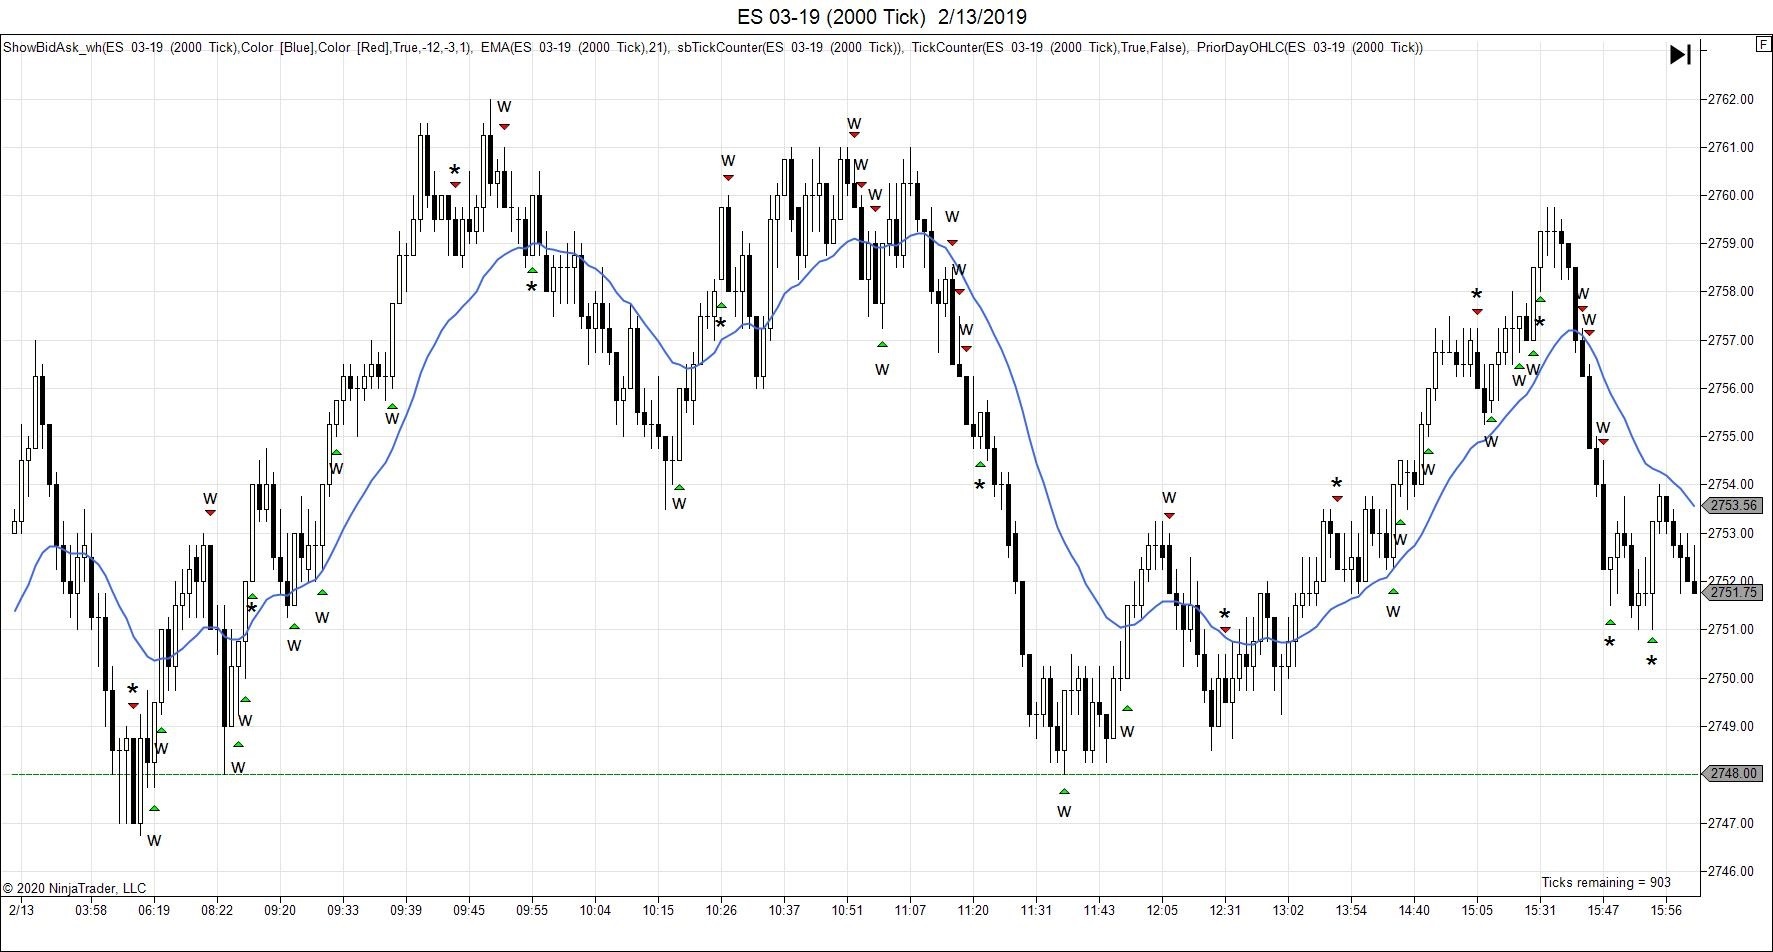
1.3 Exploration of Bars Closing on High or Low To Show Momentum
This investigation is not a trading system, and many of the techniques within PATS assist in refining trading to only very high probability trades. However, this exploration, as well as reviewing other charts for confirmation, may begin to show where trading biases can be uncovered.
In the enclosed graphic, I have marked bars which closed on their high or low. I have marked the charts slightly differently but the simple marking should be obvious. Please work through each bar, beginning from the left (as if one was trading), and ask the following questions:
-
If a stop was created above a swing high or low, and one entered on that bar, would it have been profitable for a scalp (marked with a “w” for win and “*” for loss)?
-
Did that bar begin at a swing high or low?
-
How often did the bar after the entry bar close in the same direction? Why do think that is?
-
If a trade was not profitable, why do you think that may be?
Count w=31 Count *=12
This is a chart that many believe would be impossible to trade. What are your current thoughts? Please review the PATS graphic too. While there are stronger rules for PATS entry areas (and we will explore more in potential future articles), see if you can anticipate some of the momentum using similar questions and insights.
Big Swiss
 Momentum
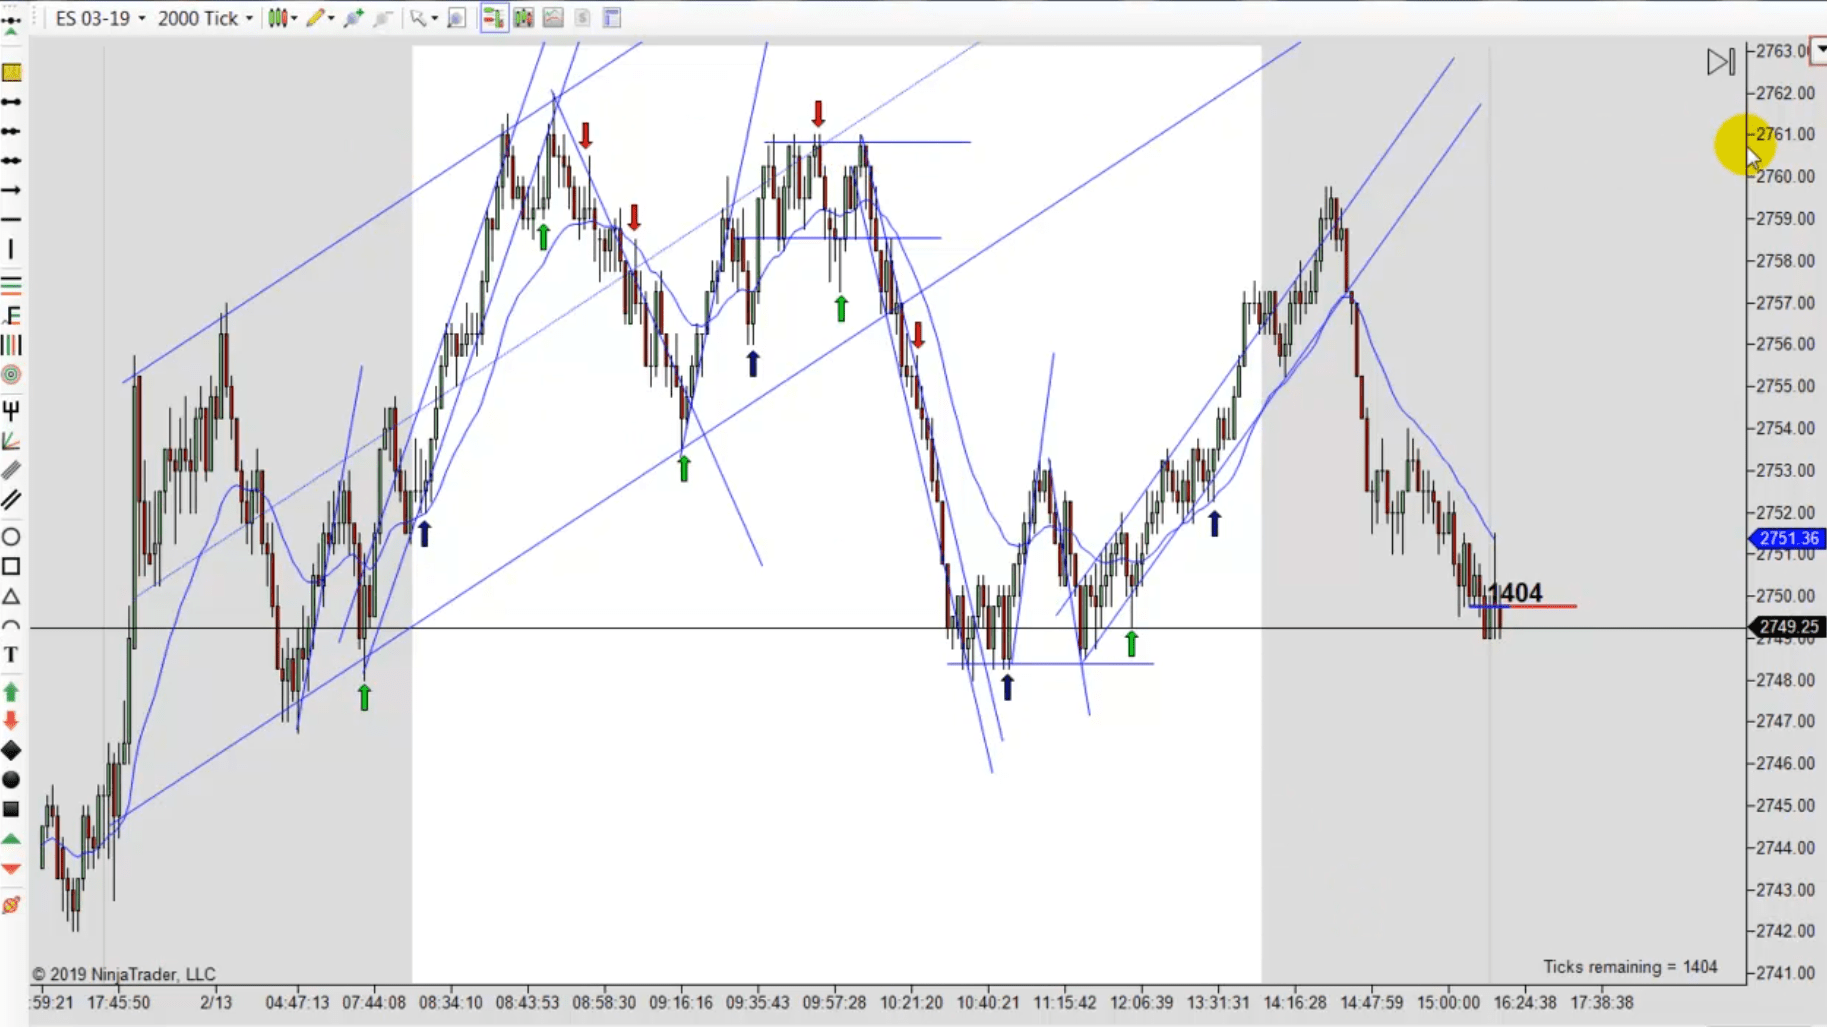 Original Chart
2. The Advantage of Tick Charts
This is another guest article from Big Swiss. Enjoy!
2.1 Using Bar Close For Decisions
The advantage of making decisions on bar close serves a few purposes. First, by restricting decisions to a bar’s close, a trader is able to review historical charts for similar situations and patterns. Without this simple reference, the myriad of variations within price movement becomes exhaustive and thus potentially significantly extending the amount of time and experience needed to evaluate the current market’s movements with any certainty (note that periods of clarity may only happen for a few occasions during a period but recognize that the clarity helps to form your edge).
2.2 Time Charts vs Tick Charts
Understanding that a trader’s action decision comes at the completion of a current forming bar, let us explore how momentum affects bar pattern formation across a variety of charts, and how tick charts may offer an advantage.
With time charts, bars complete at the end of a time interval: 1m, 2m, 5m, 15m, 30m, 1 hour, 4 hour, 1 day, 1 week etc. These are commonly used intervals. The benefit of using time charts is that intervals occur with periodic regularity. Miss a trade and you know when the next decision interval will occur, and this can potentially reduce stress in the decision making process.
Compare this with tick charts. In these graphical views, the bar measurement is the number of trades between a buyer and seller, an event where each operator believes they have an edge. Without a trade, bars do not continue to open, form or complete.
Recall that Price Action bases decisions on a few key elements: support, resistance, and momentum. Note, from the definition of the bars, tick charts more closely measure the effects of price momentum versus time charts. As tick charts more closely indicate price trading momentum, the quality of the close of a bar may infer potential continued momentum into the next bar. Pairing bar close decisions and using tick charts might then produce a small advantage. Note, with time charts if trading momentum happens through the ending of a time interval, similar aspects may be expected, but since momentum isn’t defined by time length, fewer good bars may occur in a time chart. Simplifying trading decisions reduces stress, so using a singular chart is often best. Changing time intervals to determine good entry bars may not be as effective as using a singular tick chart.
2.3 Exercise
The easiest time to observe momentum effects is reviewing price action during a trend. Review the following 4 charts. Note the quality of the entry bars in the PATS method.
Then review the time based charts of 5, 3, and 1 minutes. When do good trades happen across the time boundaries? With lower resolution time charts, they occur more frequently, but not necessarily during good places in pattern context (a future article will discuss). Also, there is less time allowed for good trade decisions. It is very possible to trade with time charts and at a variety of resolutions.
However, using tick charts may improve trader probabilities by presenting good signal bars when price momentum shifts towards their benefit. The trade-off is that an individual must be sharp and “present in attention” throughout the trading period since the bars do not complete with absolute regularity.
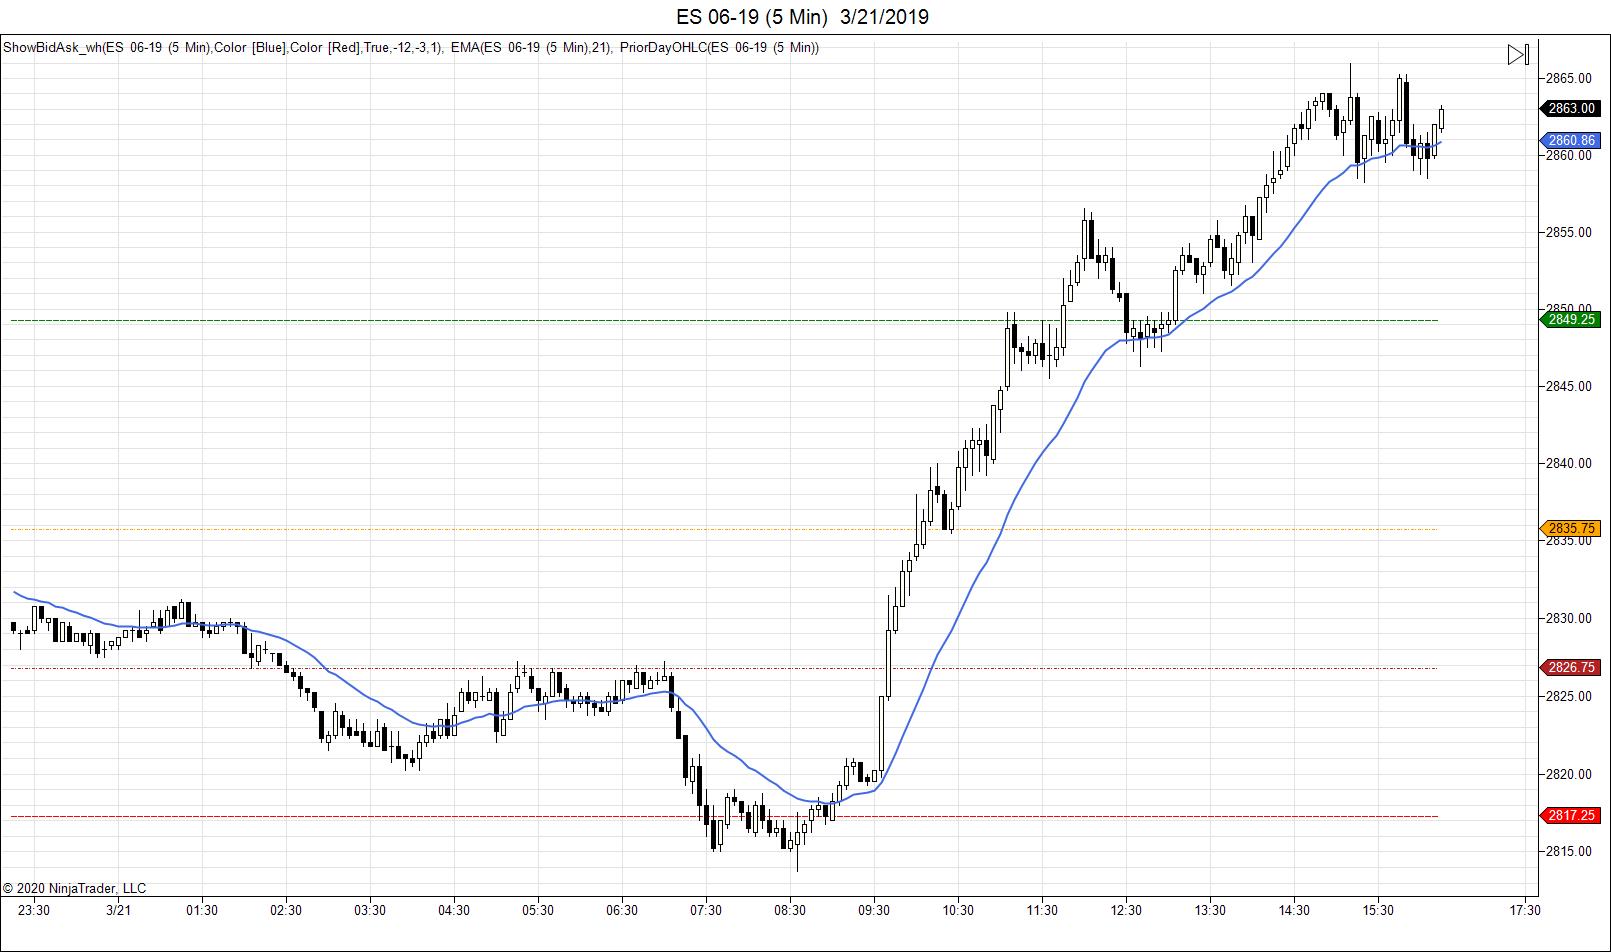 5 Minute Chart
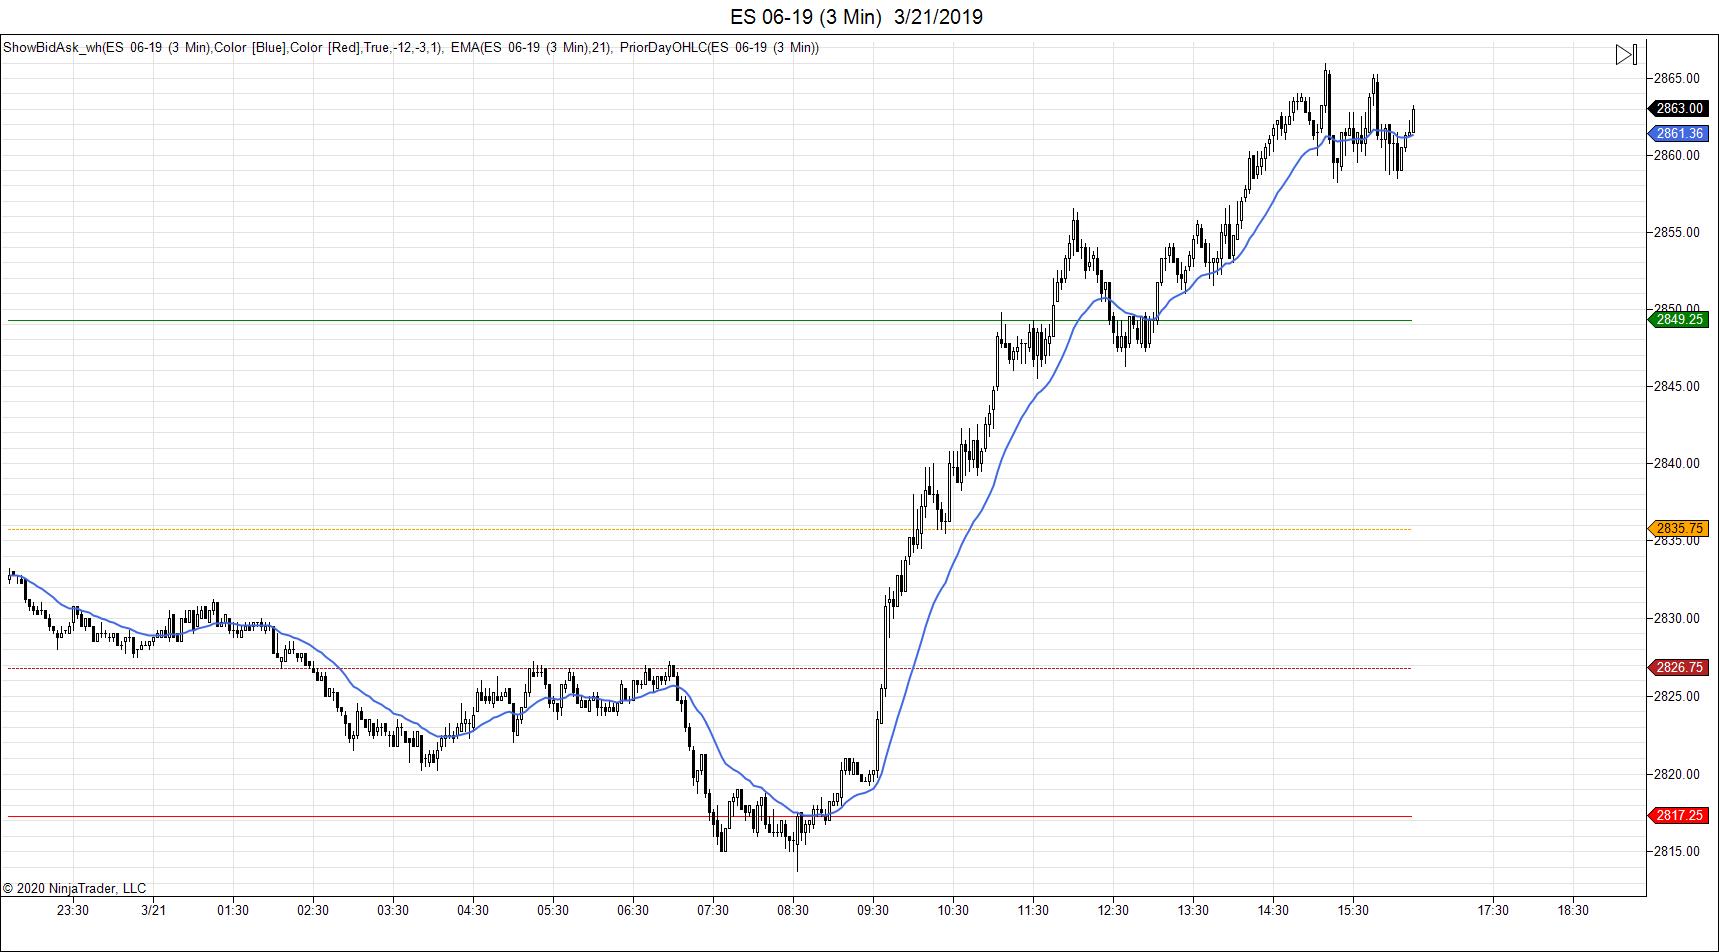 3 Minute Chart
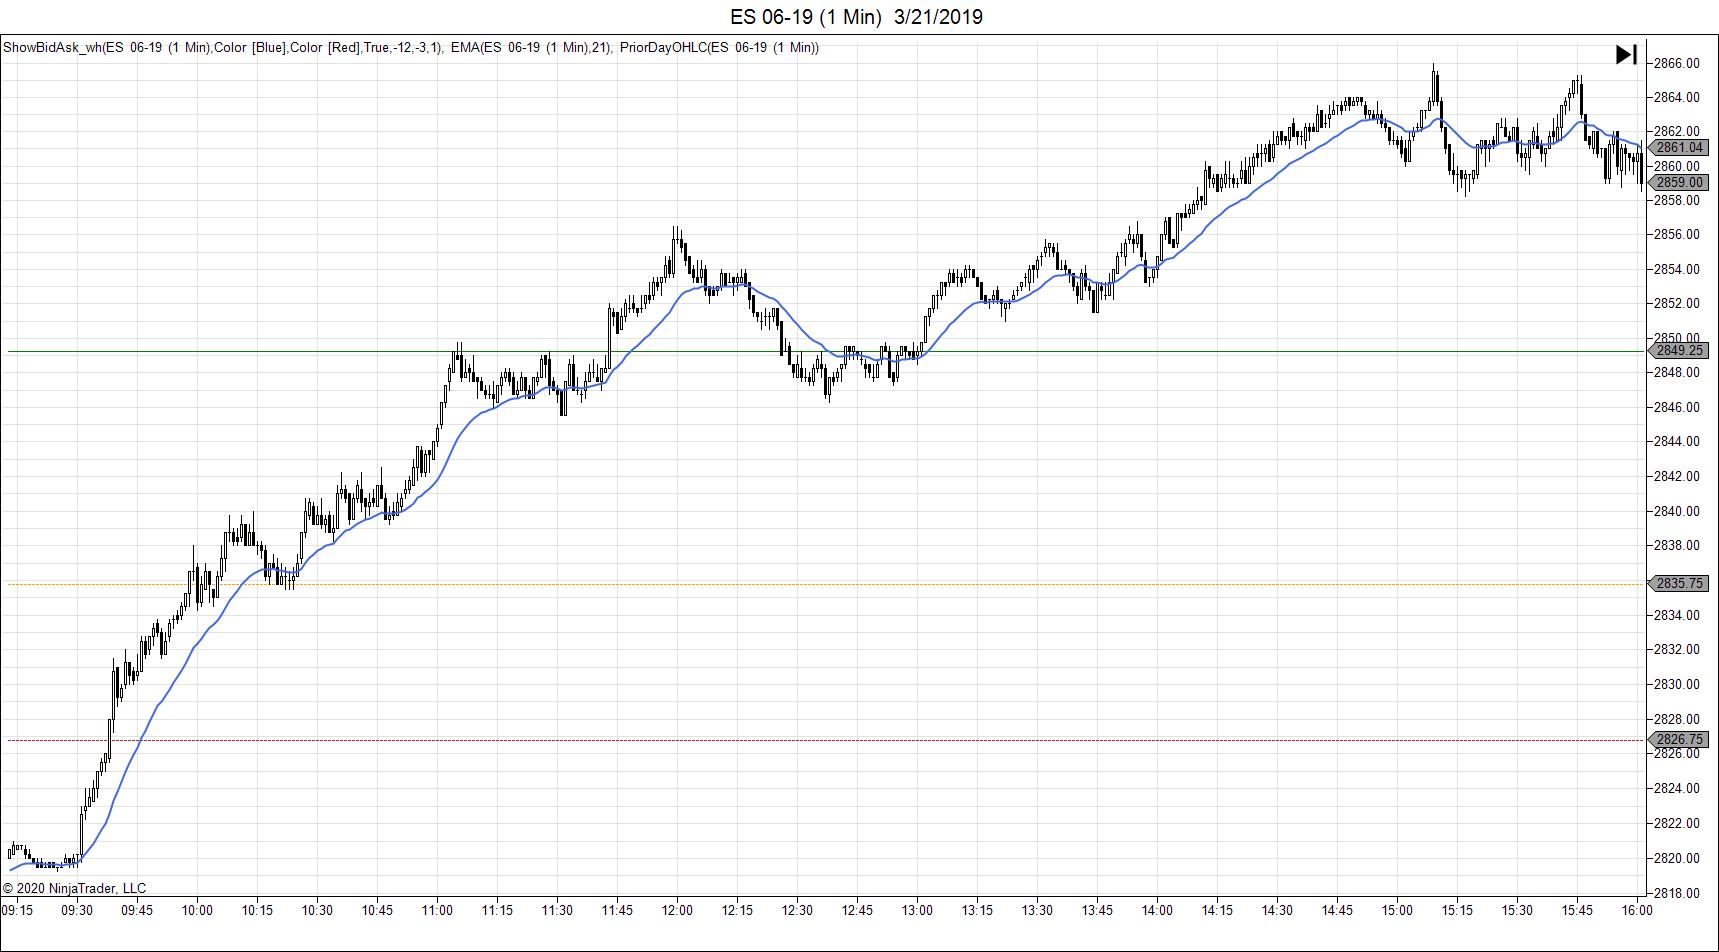 1 Minute Chart
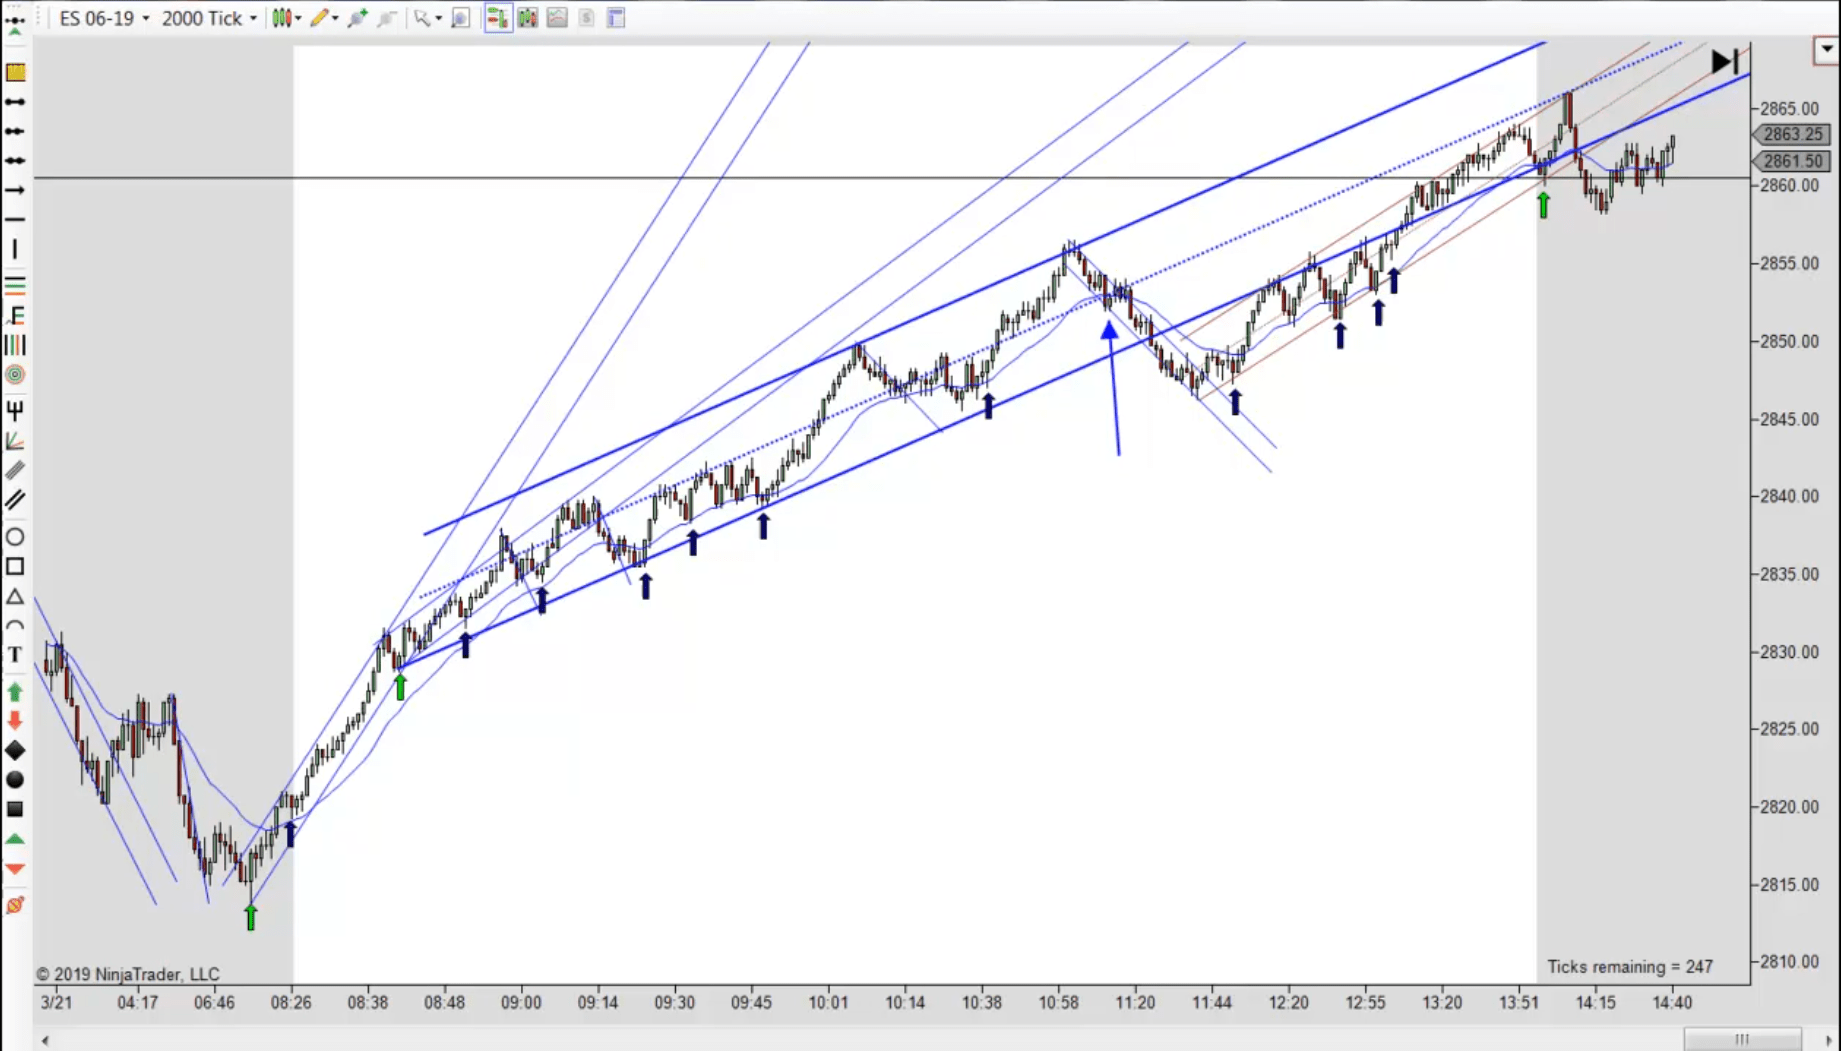 2000 Tick Chart
3. Top Gun – Reversal Bars
This is another guest post by Big Swiss! I would have to say I totally agree with the first quote below. I’m too humble to ever say something like that, but there are times I have wanted to. Enjoy!
Mack
For those who have learned how to be consistent, the money is not only within their grasp; they can virtually take it at will. I’m sure that some will find this statement shocking or difficult to believe, but it is true.
Mark Douglas – Trading in the Zone
A reversal bar is one of the most reliable signal bars, and it simply is a bar that reverses some aspect of the direction of the prior bar or bars.
Al Brooks – Reading Price Charts Bar by Bar
3.1 Quick summary and preview
In the first article, we explored price action momentum and how we can review these aspects through historical chart review. Bar closes absolutely matter, and some price patterns could influence directional probabilities. A bar closing on its high or low shows a greater probability of continuing in that direction, at least for a little bit. Finally, all trade decisions must be performed at bar close.
The second article emphasized how tick charts may assist in spotting momentum changes, or reversals. Combining the critical aspects from the first two articles, here we will review a foundational aspect which can potentially turn your trading “right side up” – the reversal bar!
Reducing trade selection efforts to exclusively using the perfect reversal bar as the signal bar, in combination with second entries and other price action characteristics, a trader will quickly find his success ratio approximately at 80% or potentially higher.
3.2 A little math
Target: 4 ticks. Stop: 8 ticks or at the swing high or low (whichever is greater)
Let’s temporarily exclude the costs of trade execution, exchange fees and the costs of “doing business”, as they are much smaller in comparison to the profit.
In the ES, a win nets +$50, while a loss results -$100. Therefore the barrier for profitability begins at approximately [100/ (100+50)] or 67.7% or significantly worse than a coin flip.
If a “guess” represents an assumption that we are only 50% correct in estimation, then any time during a trading session that you do not have absolute confidence in the trade, or uncertainty in your “reading of the market”, then please simply pass on the trade as your estimation is certainly less than 67.7%.
By further reducing all activity to the highest probability cases, you will be using a trade selection much better than 75%. Reviewing historical price action can confirm this. That is potentially a 7% or greater advantage which, if rigorously followed, would turn you into the casino. This isn’t a guarantee, just an opportunity. Skill at trade entry, management, and execution still play roles.
3.3 Introducing the Reversal Bar
One of the simple keys to understanding the reversal bar is that it is “reversing/changing” previous price action momentum.
In a trading range, which represents a lack of momentum, seeing a reversal bar has much less meaning, and is one of the reasons that reliance on candle stick patterns often proves fatal. If there isn’t much directional momentum to reverse, a price pattern will have a much lower probability during these periods.
Price action is not about candlesticks, but reading the shifting momentum of prices, especially around areas of support and resistance (a future article and Mack has several listings). While candle sticks can assist a trader in evaluating the strength and waning of momentum, training the eyes to see how this visualizes is the critical aspect. The reversal bar is about shifting and changing momentum into the opposite direction. Simple.
3.4 Characteristics
Exploring the best bull reversal bars, you will note the following characteristics [Al Brooks edit with personal discussion] (note the reverse for bear reversal bars):
-
The current potential signal bar opening near or below the close of the prior bar and then closing above the current bars open and above the prior bar’s close [The signal bar is a bull bar and is already reversing through previous bearish price levels].
-
A lower tail that is no more than 1/3 – ½ the height of the bar, and a small or nonexistent upper tail [prevents the signal bar from having trading range characteristics. Also a strong close improves directional momentum]
-
Not much overlap with the prior bar or bars [Overlap shows a lack of directional momentum. If there is a lot over overlap the reversal may be more indicative of trading range behavior or the pause of the current directional movement].
3.5 Unpacking the Reversal Bar
Keeping it simple …
For the bull reversal bar, we are reviewing price strength for opportunities where the downward pressure is waning and changing. If downward pressure is reducing, that in effect means that purchasing power is entering the market. This is mostly clearly seen as a bull bar where the body has a good size in relation to any lower “tail”. Since a tail represents an area where prices moved through and then reversed, a long tail in relation to the candle body indicates indecision – trading range behavior. On time charts this is easily reviewed by reducing the time interval. However, we always want to use only 1 chart (simplify actions and considerations).
The above rules then simply emphasize a shifting of directional momentum from one direction to another. Does this mean that a reversal signal bar absolutely creates a worthy trade entry? ABSOLUTELY NOT!!!! This is another area where candlestick “science” fails a less experienced trader.
The pattern evolution of prices (to be explored in a future article) takes precedence over any particular “bar” type. Additionally low probability “events” happen at some of the most unexpected and inopportune times. This is a more clearly stated by saying context is more important than any particular pattern.
So how do we overcome these limitations and restrictions and visualize the appropriate times that a potential trade provides a clear opportunity to profit?
3.6 Framing the Reversal Bar
Now that we have summarized a few important rules for the reversal signal bar, let us put specific guidelines to these characteristics to create the highest potentially opportunity, as well as visualize these cases. Seeing is believing!
-
2 bar reversal w/o much overlap. Direct and immediate reversal of momentum in the shortest period (2 bars). A bull bar signal bar following a bear bar or the reverse. If the first bar is a doji the reversal of momentum isn’t as strong.
-
The reversal signal bar begins (if a bull bar) lower than the previous bear bar. By beginning lower, bears from the previous bar have had the opportunity to sell 1 tick lower. By then reversing upwards, this enhances the possibility of trapping bears.
-
The reversal setup bar closes on its “high” if a bull bar, or “low” if a bear bar. Strong closes have the highest probability especially as the signal bar. With some experience, this can be extended to 1 tick tails from the close, but there is slightly less probability as a result (the bar could have been stronger). Two tick tail closes sacrifice too much probability for consideration. USE KEY ENTRY POINTS.
-
Reversals occurring at or near swing highs or lows within the price action. Second entries are preferred. Note the price action pattern should not be tight since highly directional moves without prior exhibition of sufficient reversal strength only indicate a brief pause and not a potential reversal (covered in price patterns).
-
The reversal bar does not grow overwhelmingly big. For example if average price bars are 2 points, and the potential signal bar is continuing to grow beyond 2 points, the risk may not be worth the probability as the “move” may already have occurred. Additionally, stop loss risk must be 1 tick below the (bear bar) high or (bull bar) low of the signal bar or the price swing high or low [whichever is greater]. Note that the risk may be too great.
-
Reversal bars forming near swing high or lows. These areas indicate previous price area ranges of support or resistance which may repeat. This rule helps to ensure other participants may also protect price levels resulting in a reversal. The swing high/low is used because that is where previous price reversals have occurred. Having the signal bar be the swing high or low may add emphasis.
-
Reversals near previous areas of support and resistance also offer similar opportunities.
-
Potential trap situations. If the previous bar is a bear bar closing on its low (strong bear close), and the price action opens lower, then the bear shorters have had an opportunity to sell on a stop one tick after the bar close. With the price action reversing by beginning lower than the strong bear bar and then proceeding to close higher than the bear bar’s close and closing on its high, this sets up a potential reversal trap if the momentum continues, which is expected.
-
Reversals need to be sufficiently far from potential areas of resistance (do not trade into resistance areas).
3.7 Limiting to perfect
One really need only 1-2 trades a day on average to be successful.
Trading only the best opportunities allows for experience to grow. Add 1 tick from close reversal setup bars next. They are slightly lower in probability, and based on context may perform equally as well.
Wait patiently for your opportunities. They always come.
3.8 TOP GUN
On March 3, 1969 the United States Navy established an elite school for the top one percent of its pilots. Its purpose was to teach the lost art of aerial combat (price action) and to insure that the handful of men (and women) who graduated were the best fighter pilots (traders) in the world.
They succeeded (join them!)
Investigation:
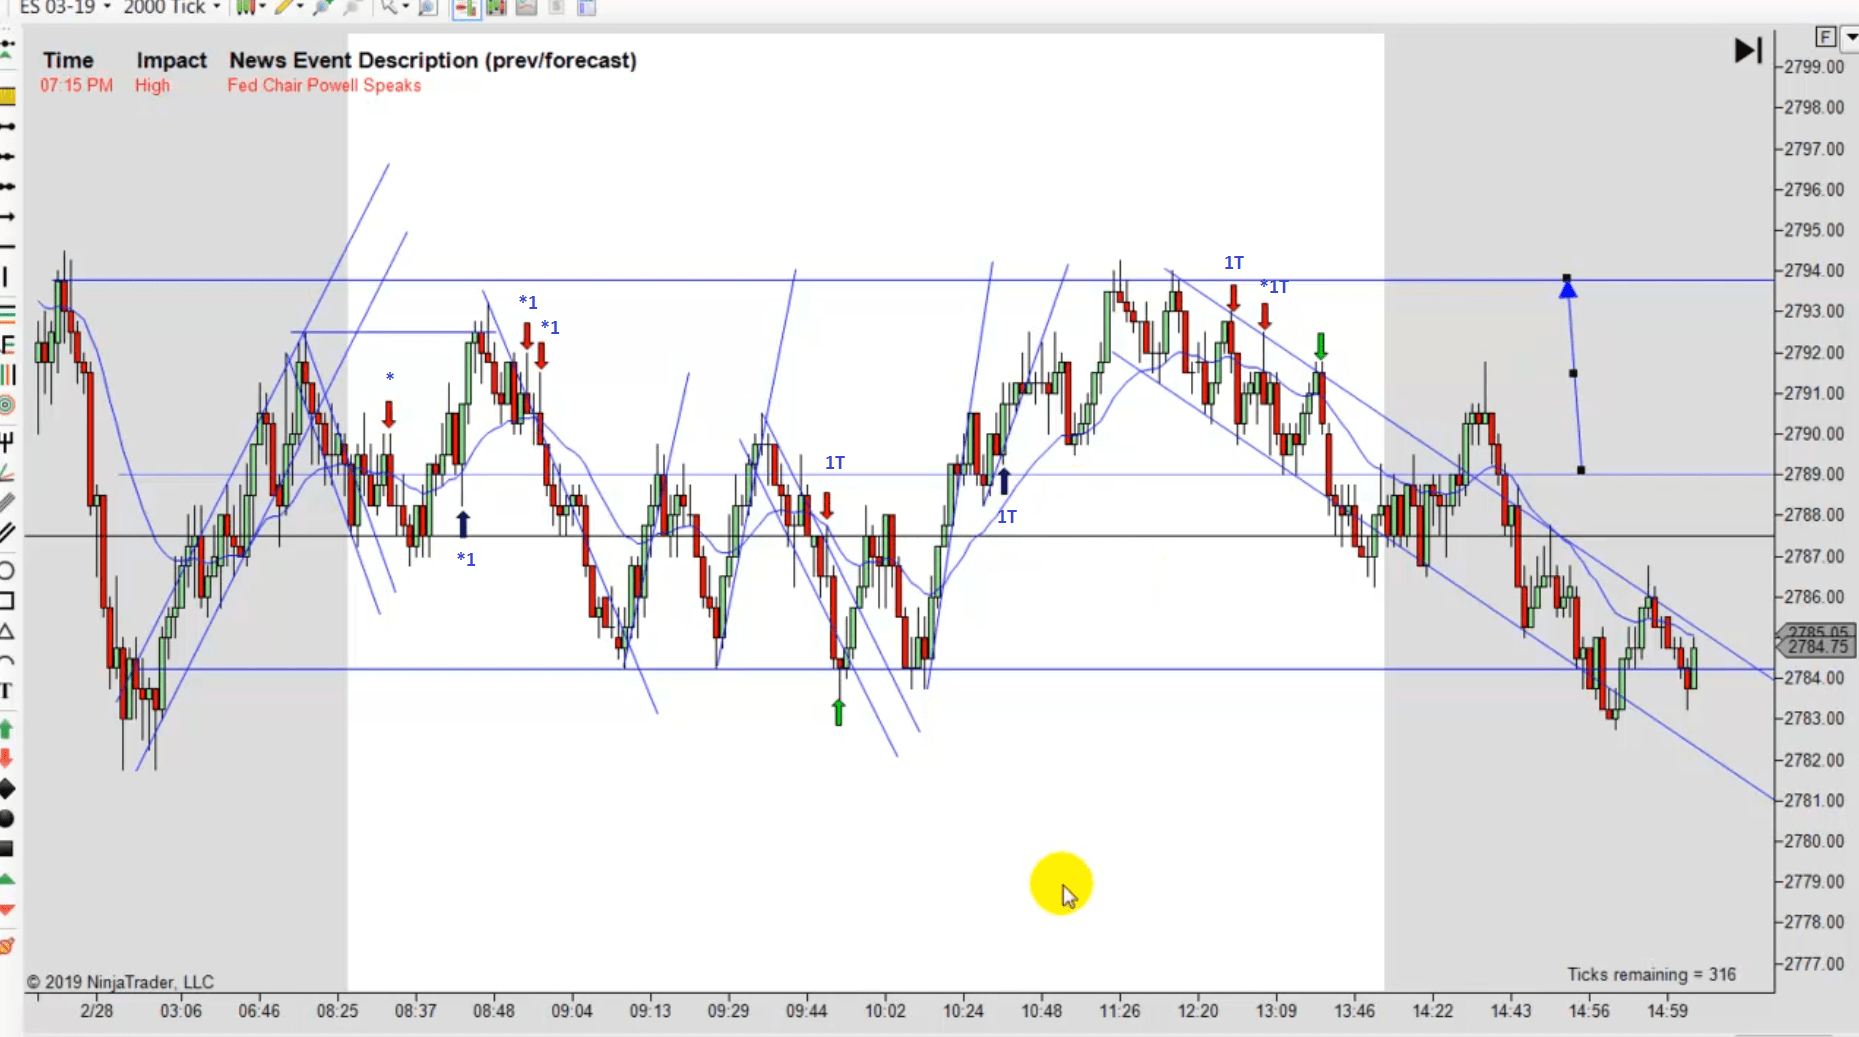
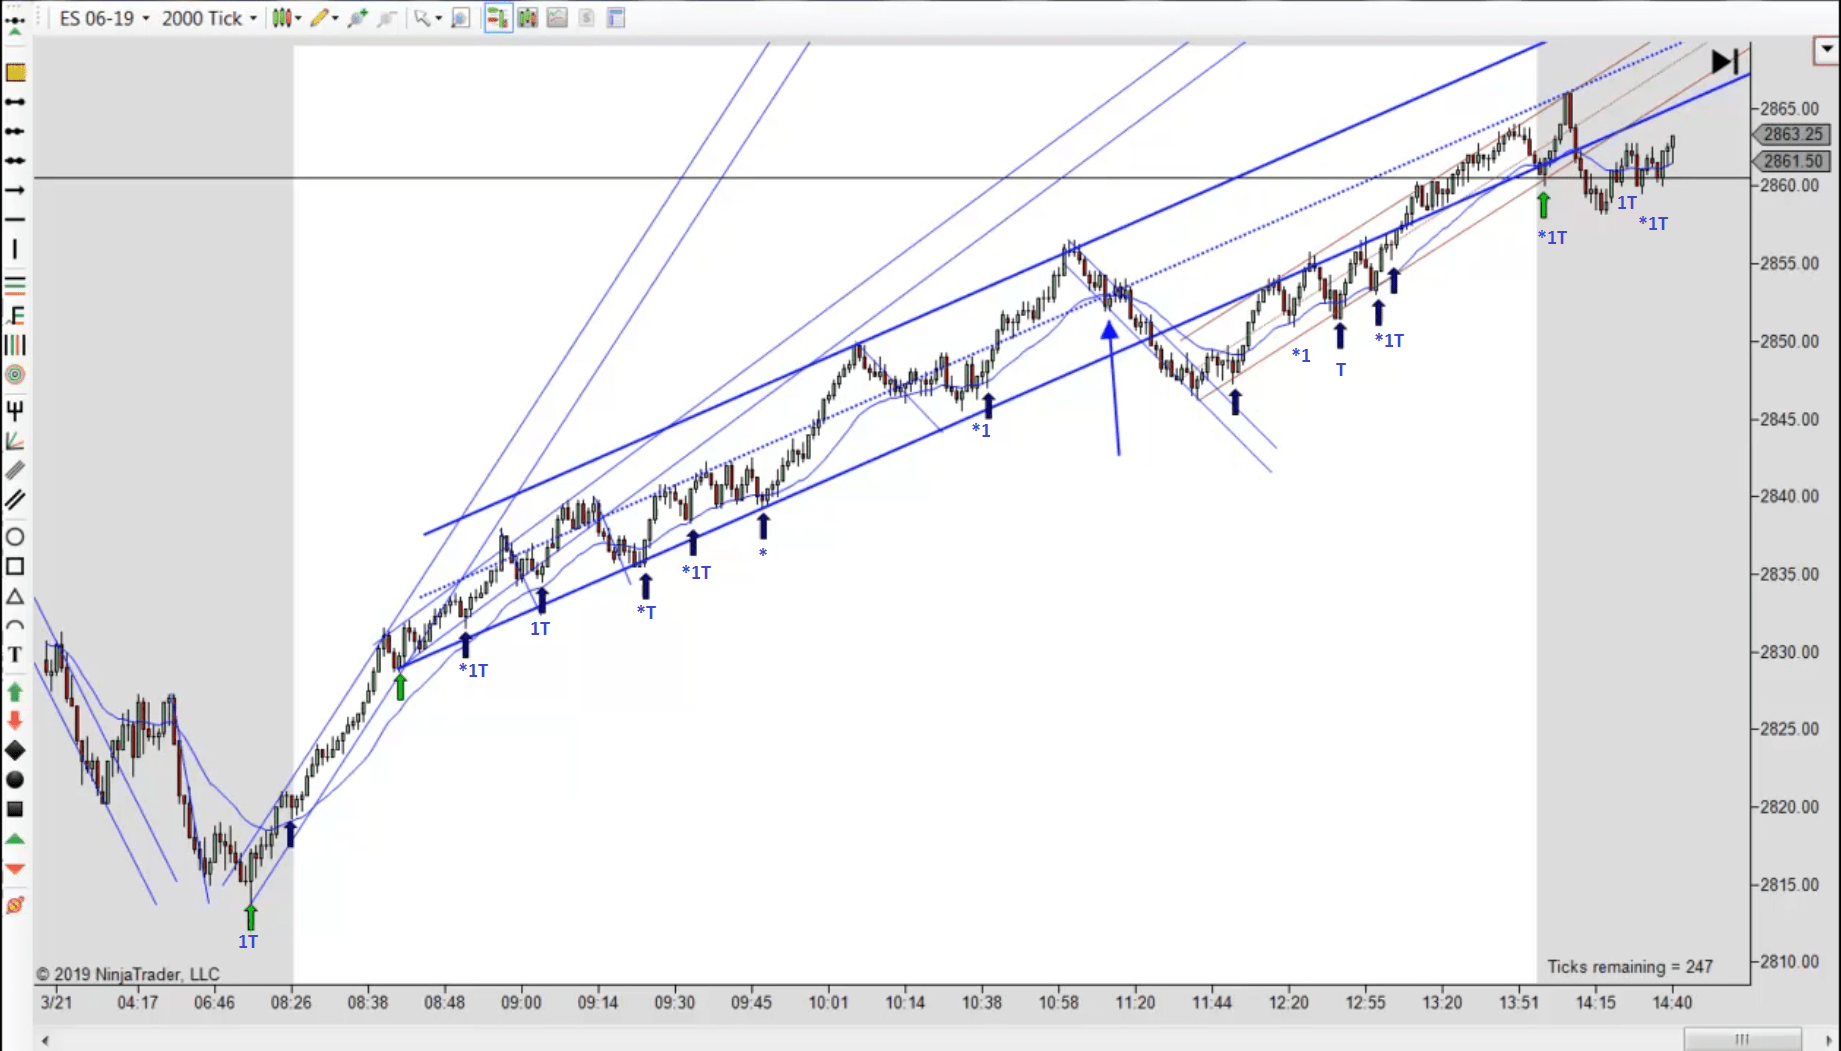
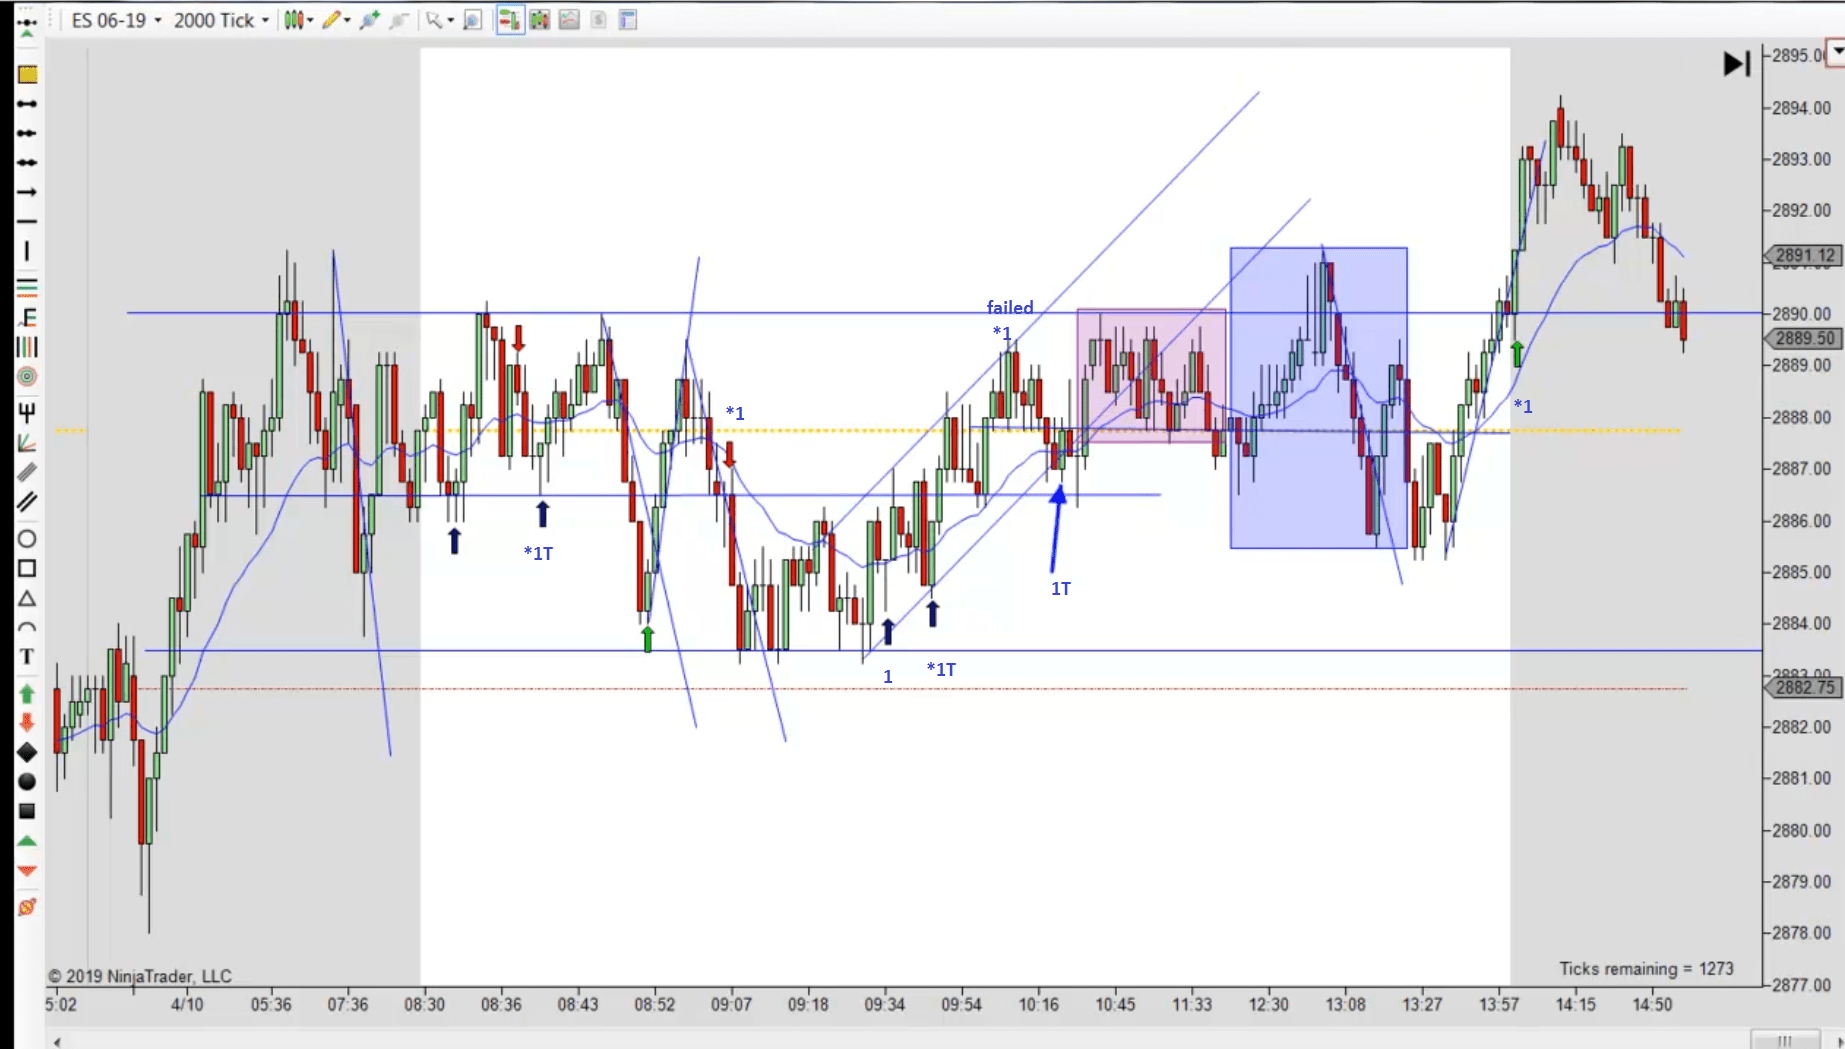
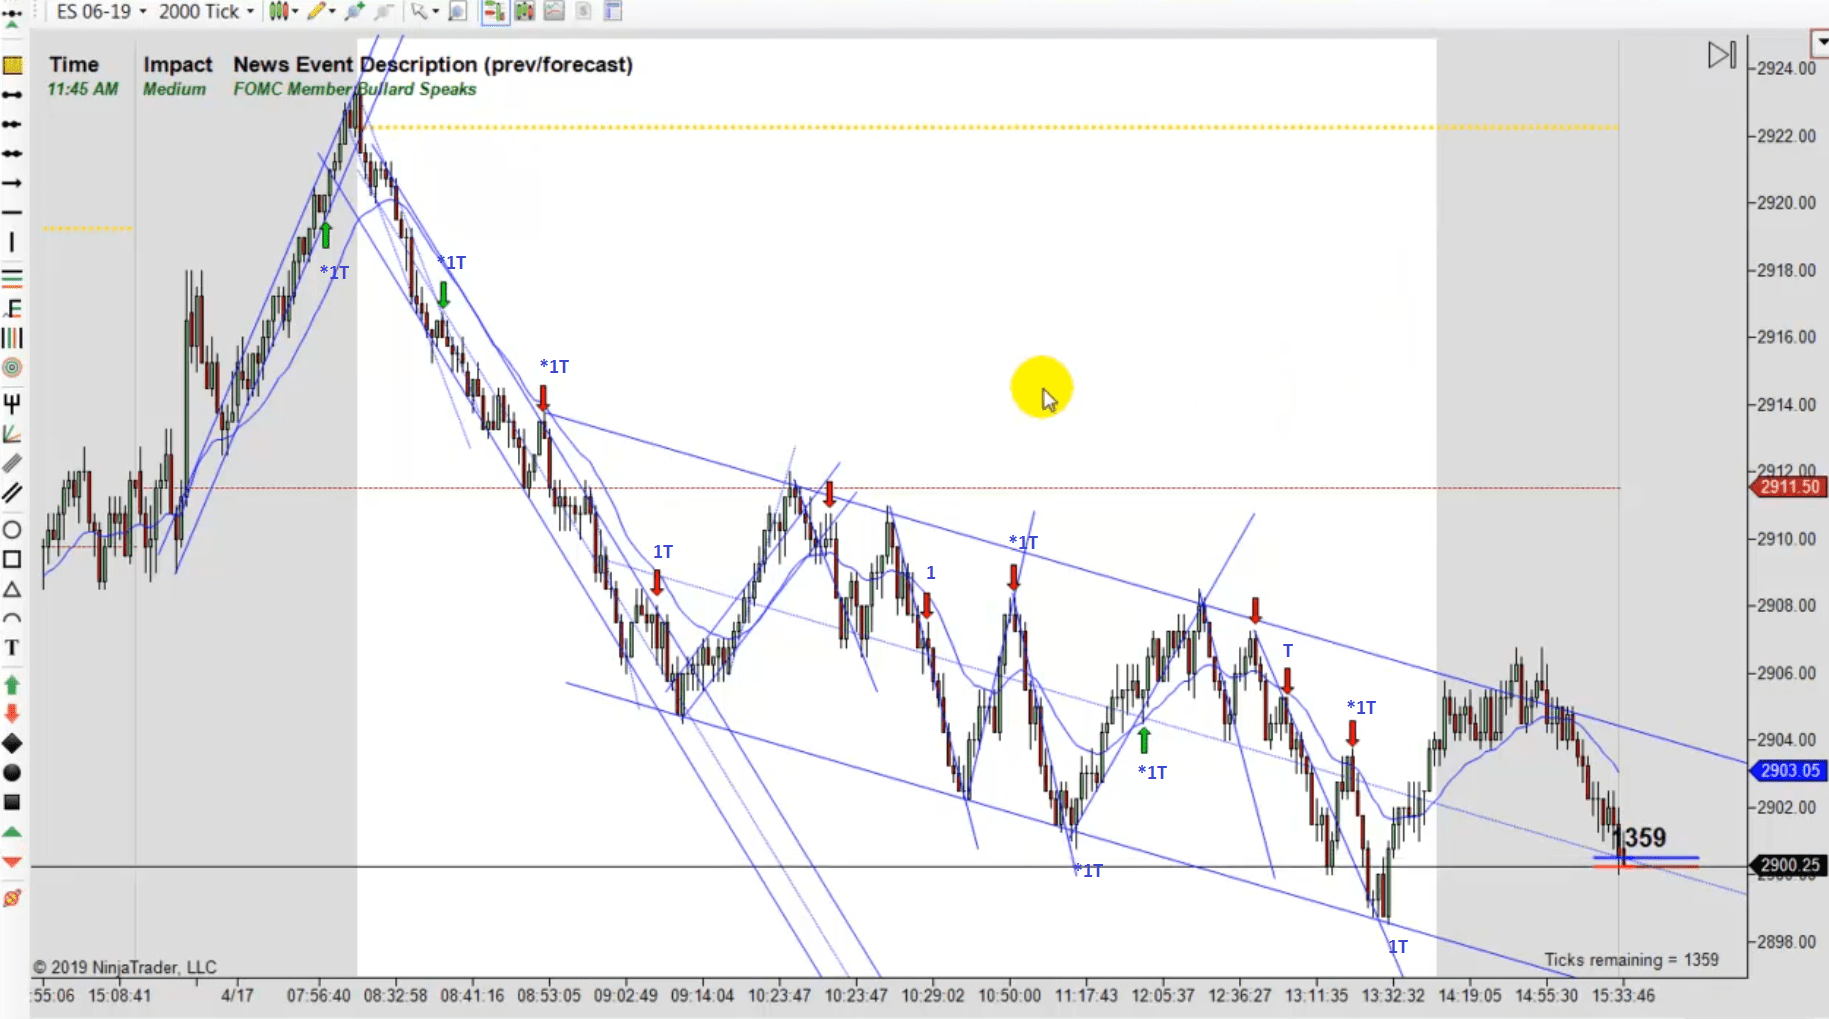
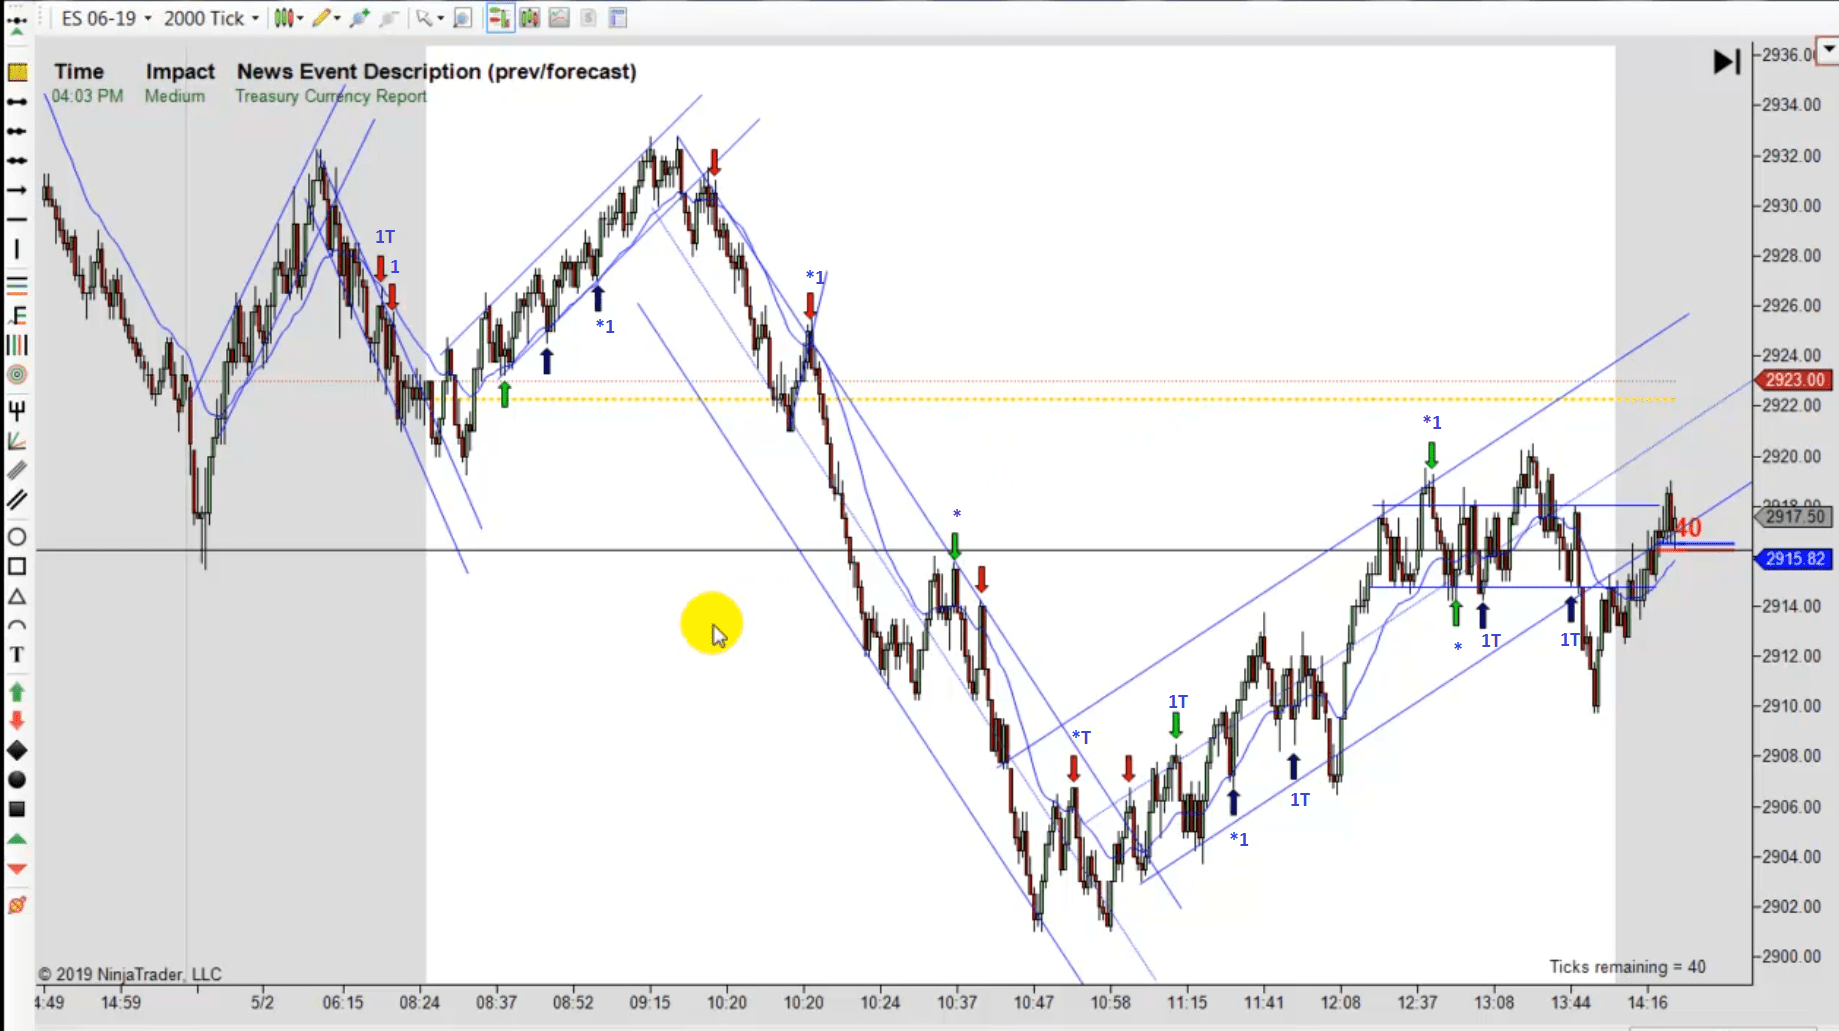
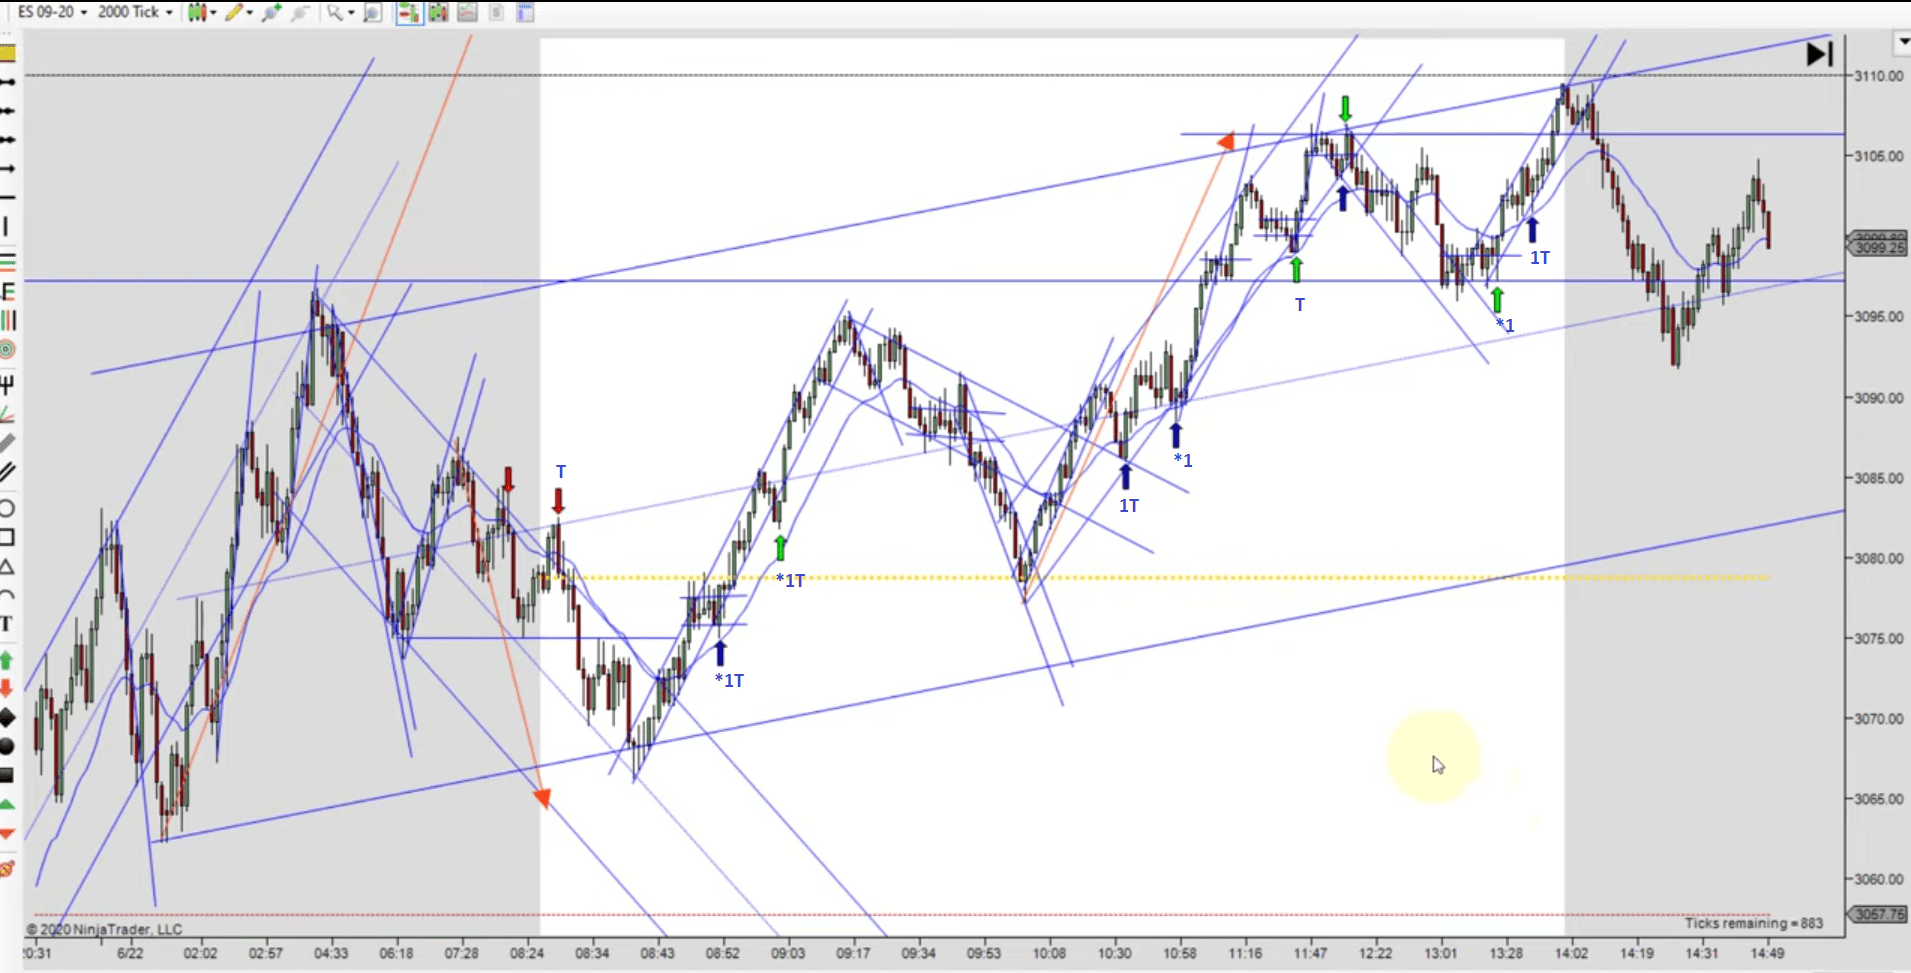
The reversal bar offers the highest probability trade. Review the following charts. Note that the majority of charts are from 2019 simply because one frame can easily capture the visuals. Reviewing any period will show similar price occurrences.
These “perfect” opportunities may be less frequent but by restricting the setup to the best situations you are offered the greatest opportunity for success so please ensure that you recognize them as they form. Is the current forming bar at a swing high or low, a 2nd entry potential, at a resistance area, and the bar closes on its high or low?
Legend:
“*” – perfect momentum signal bars
“T” – potential trap with reversal bars
“1” – Signal bar 1 tick lower than previous bar
Questions:
-
How often do these situations occur with blue or red arrows (also good probability setups)?
-
Note how many of the blue and red arrow marked signal bar trades begin at least 1 tick higher or lower than the previous bar (big kudos if you have seen this already)!!!!! Consider the effect of this momentum shift.
-
For each day, how often did these trades succeed? (4 ticks).
-
Are they 2nd entries?
-
How many other similar situations failed (look for perfect reversal signal bars)?
-
Gather a month’s worth of historical charts from PATS videos and note the same instances. Estimate the probability of perfect setup completions!!!
-
Does the trap potential aspect make sense based on a reversal of momentum when the previous direction was able to continue slightly more before the momentum change?
-
If the price action is in a trend, and the setup is at the 21 ema, is there a difference in results from a perfect signal bar and a 1 tick from close signal bar?
-
During areas where price “turns” do other patterns suggest high probability for future exploration?
By exploring these questions, a trader’s eye may capture small “details” which previously may have been overlooked. With time and experience, perspectives can positively shift. After a while, what was mysterious simply becomes natural …
We have refined trade selection a little more. Grab some charts and review!