How To Setup A Clean Trading Chart
24 Mar 2021
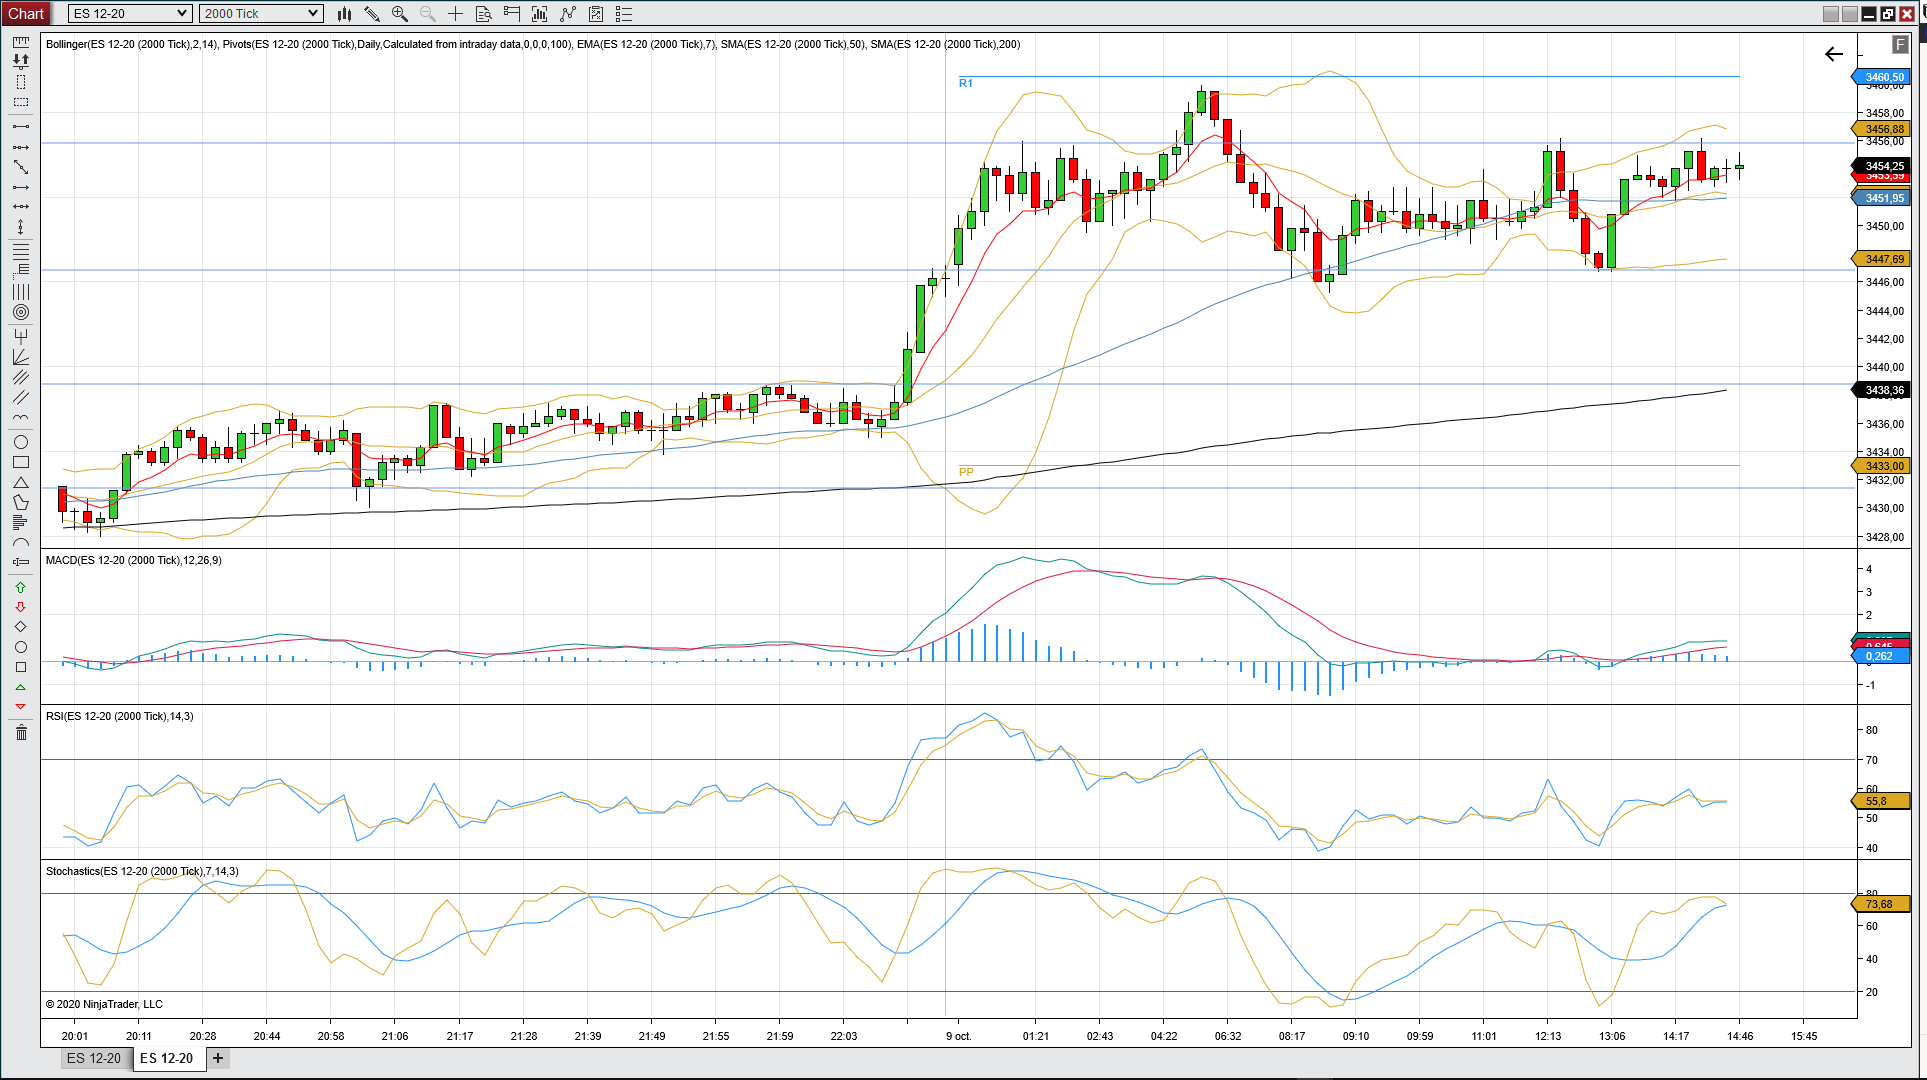
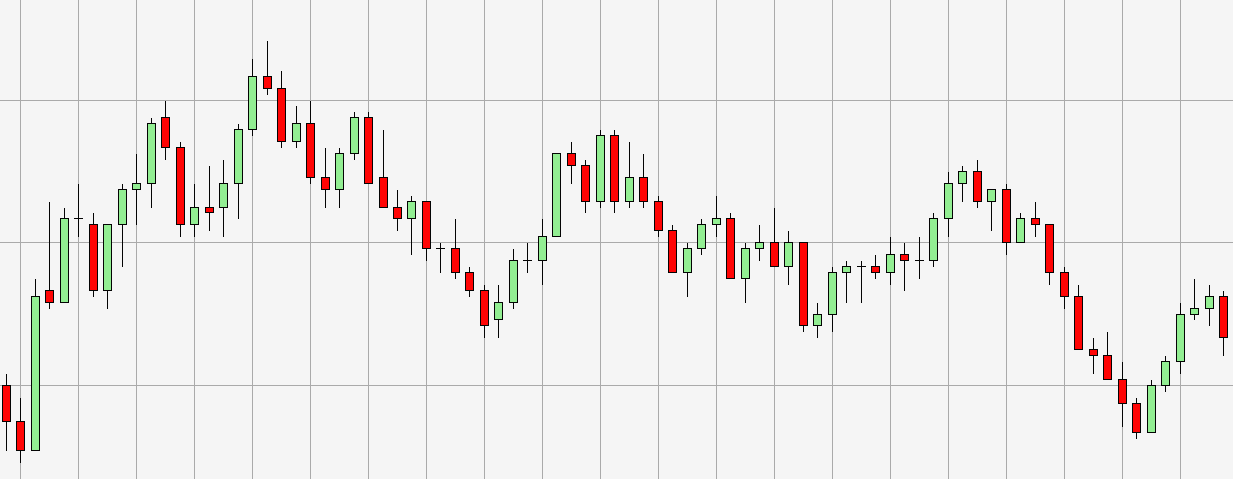
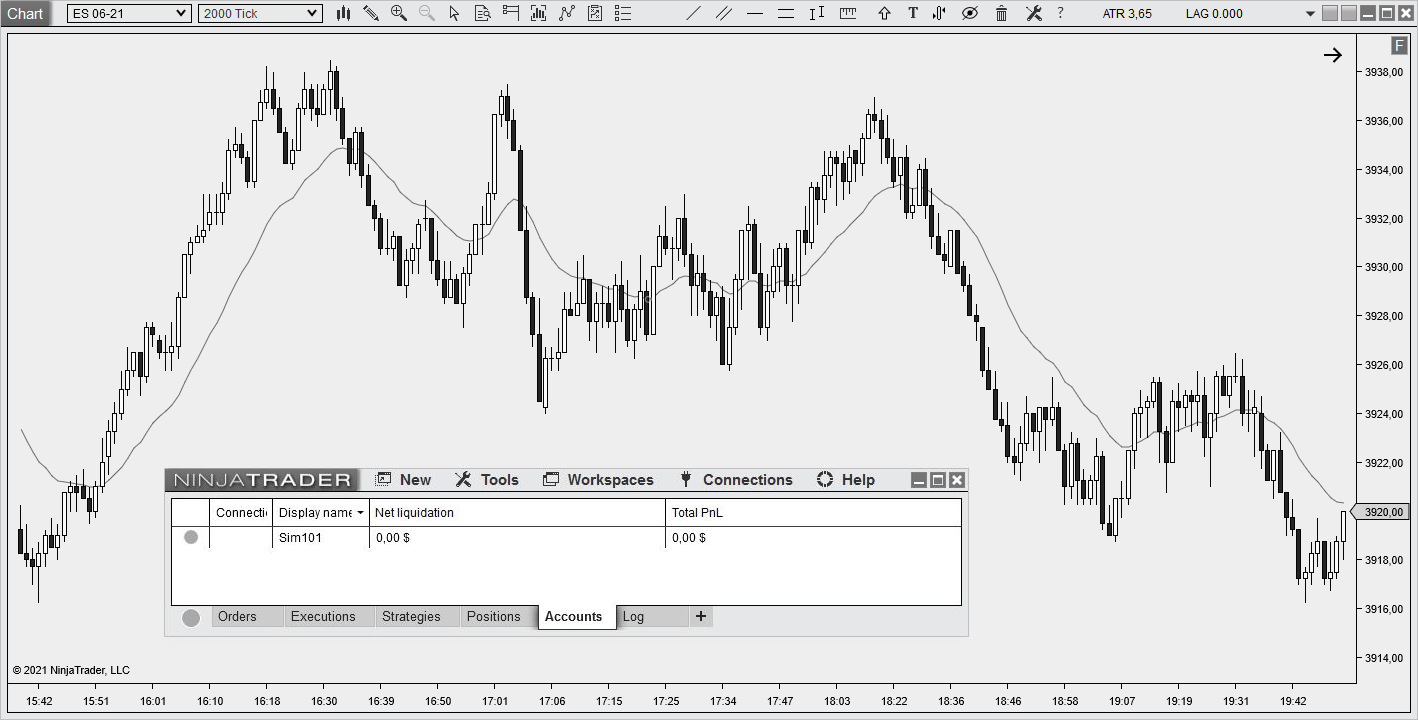
When I started trading, I had a chart with a lot of indicators: oscillators, multiple moving averages, Bollinger Bands, Pivot Points, …
It looked something like this:
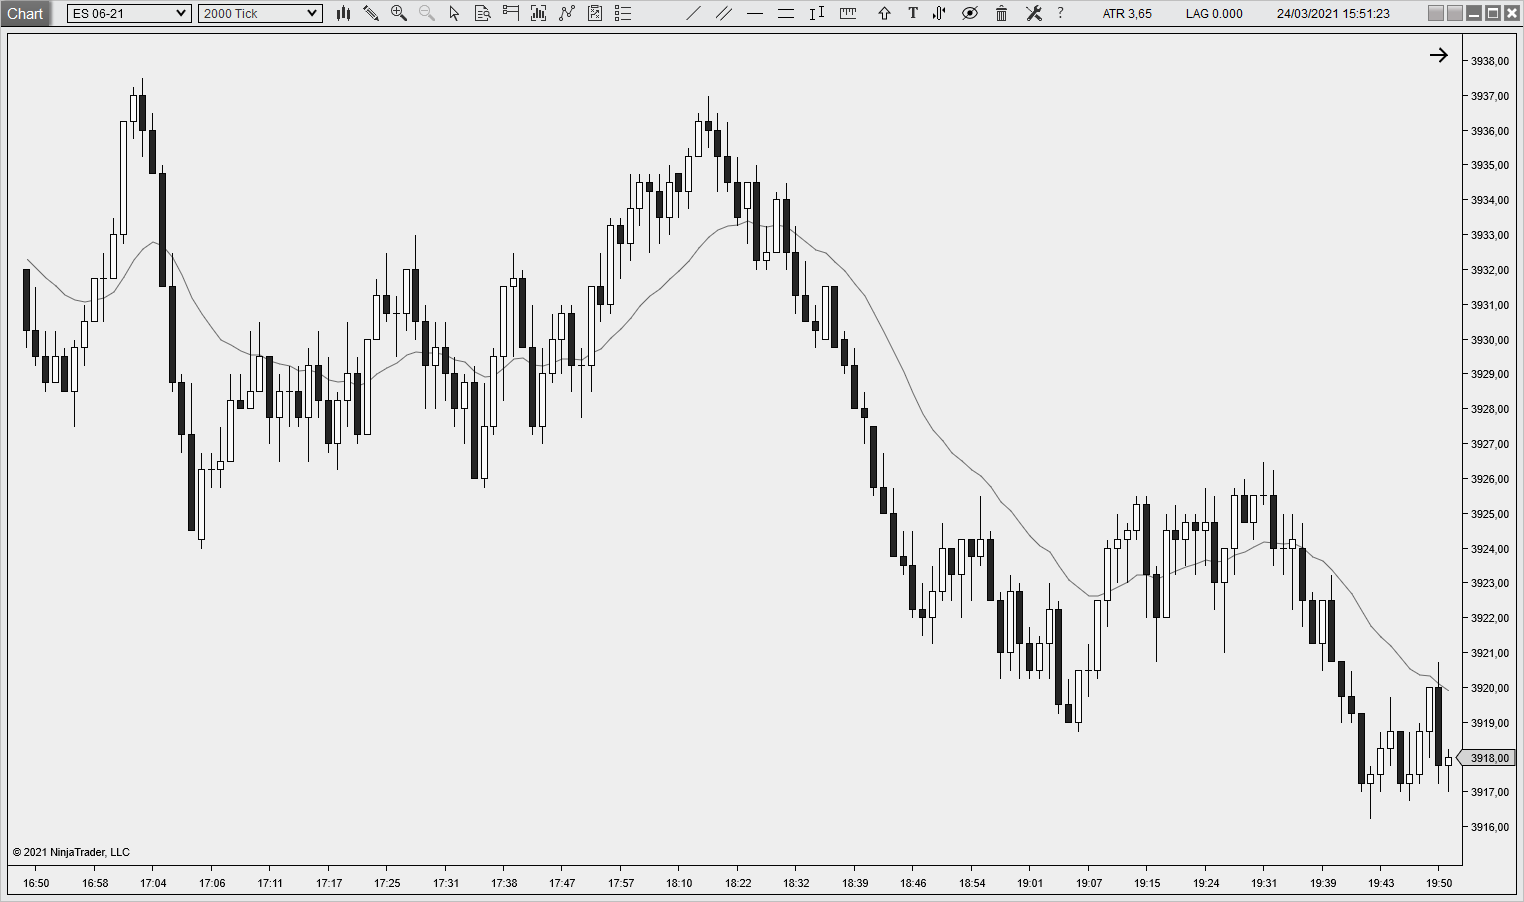
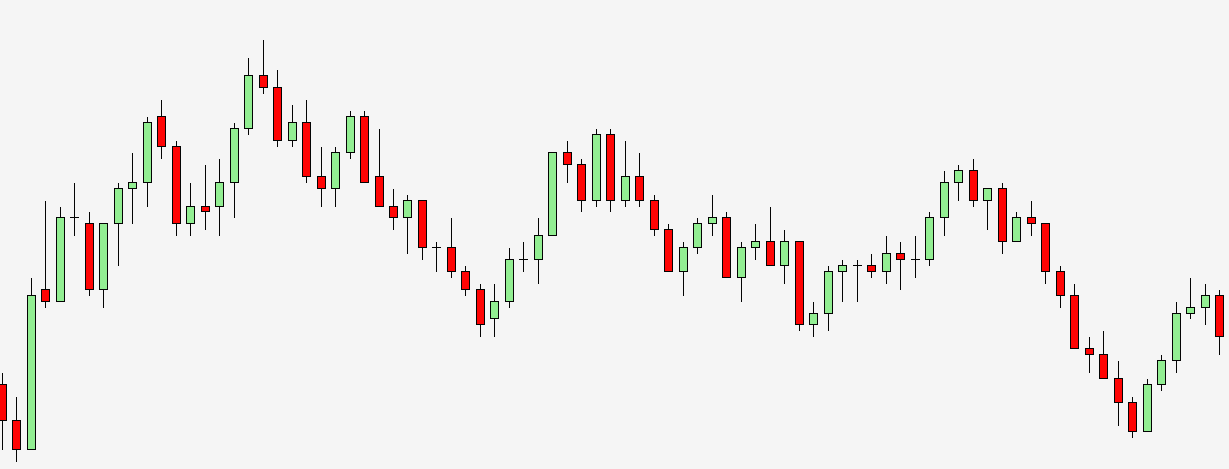
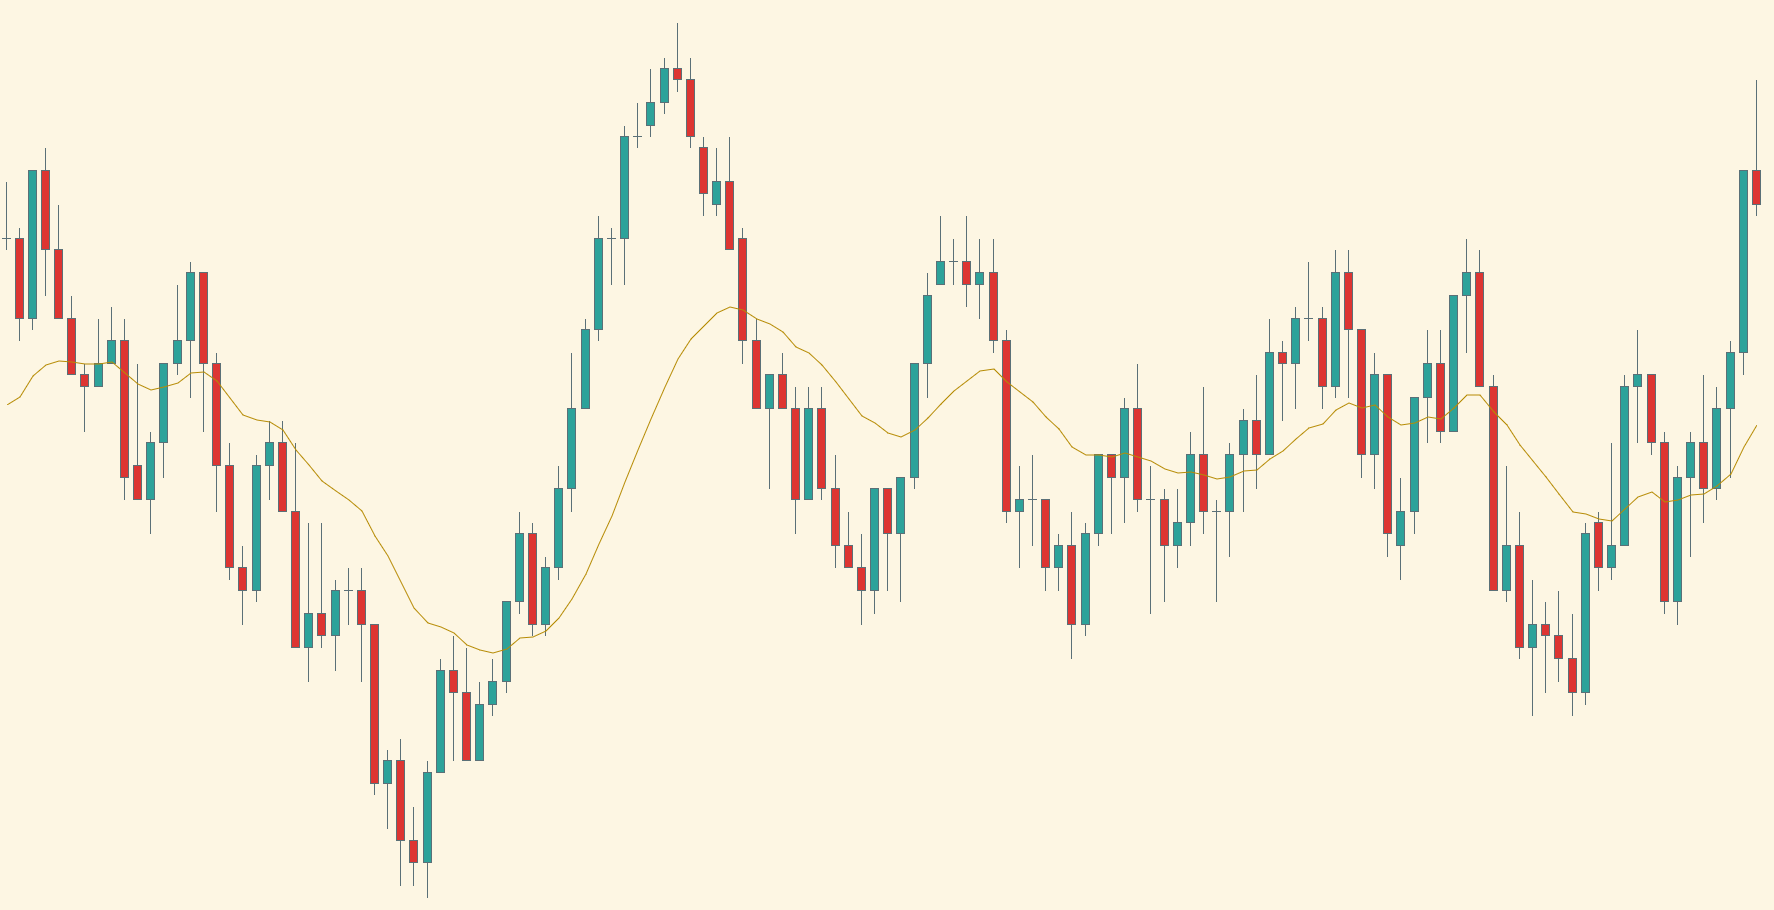
Now my trading chart looks more like this:
Why is a Clean Chart better?
The goal is to be able to trade the most effective way possible.
If you trade directly from your chart like me, your trading chart is the only thing you need. It’s your working tool and you will spend hundreds and thousands of hours watching it.
What we do is very visual, so we should be able to read our chart and analyse it easily and quickly.
We need to:
- Work on the substance/content: Remove any distraction so we can quickly see things and focus on whats important.
- Work on the form/design: Improve what’s left to keep our mind and eyes at ease so we can feel calm and focus longer without being tired.
How to Setup Your Chart?
Note: I am using NinjaTrader 8 here but I guess you could get similar results with other platforms.
Step 1: Remove distractions
Less is More
Ludwig Mies van der Rohe
Perfection is Achieved Not When There Is Nothing More to Add, But When There Is Nothing Left to Take Away
Antoine de Saint-Exupery
As price action traders we like “naked” chart so we need to remove anything not useful.
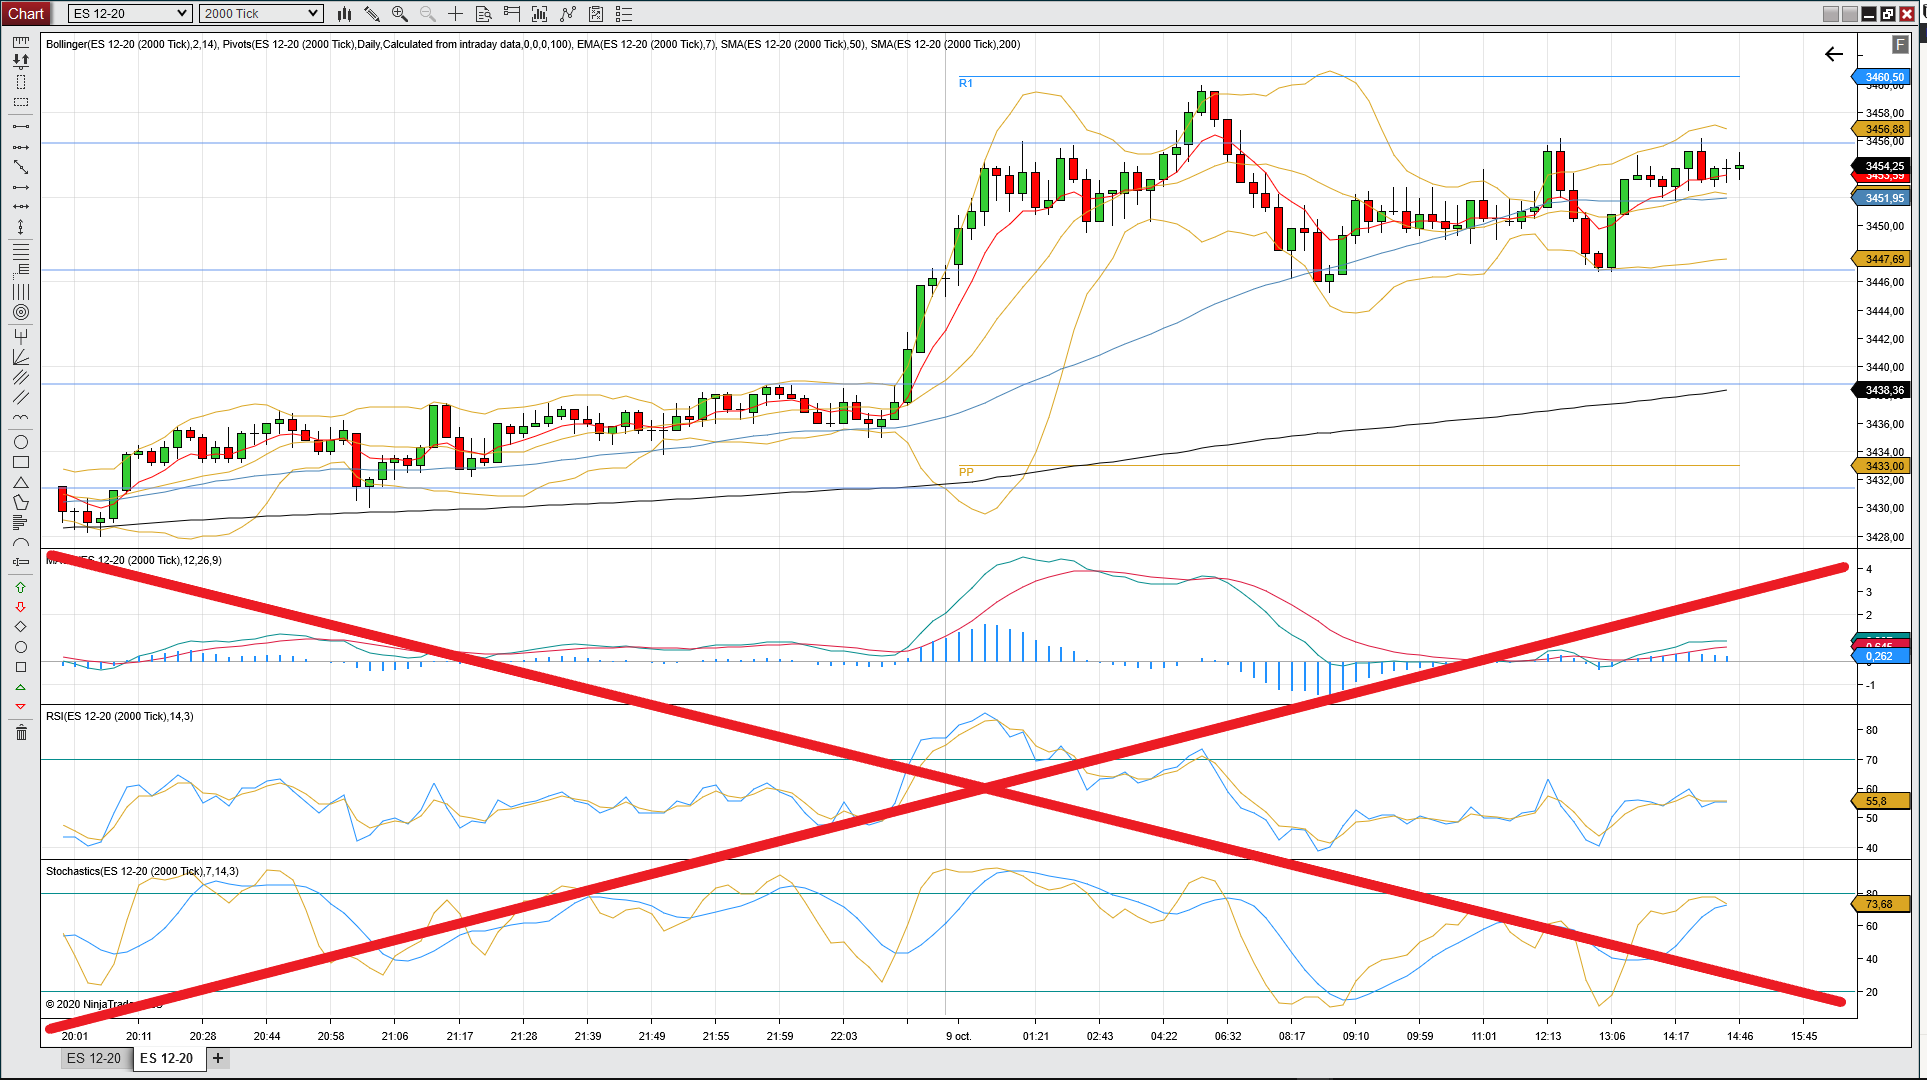
Remove useless indicators
I don’t use many indicators, especially those under my price panel because they take a lot of space. I try to plot all data I need directly on my price chart.
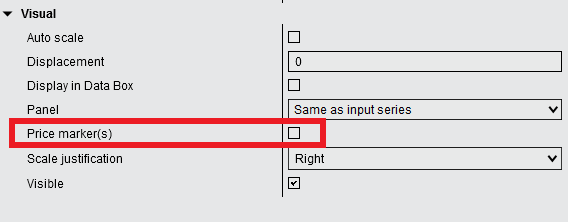
Remove price markers
Do you really need to know the exact EMA value ? Uncheck “Price marker(s)” box in your indicator properties. The only one I keep is the last price.

Remove grid
Remove the grid. You don’t need it. It obscures your ability to relate current price movement to historical price movement, through drawing your attention to price relationship with gridlines. It’s unnecessary information which just adds to your sense of overload. Removal of the grid surprisingly has quite a large effect in terms of simplification.
https://yourtradingcoach.com/trader/reducing-trading-anxiety-through-clean-charts/
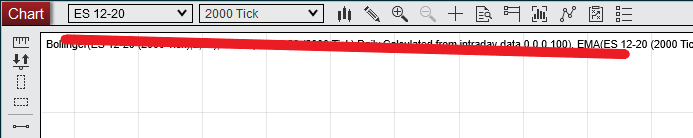
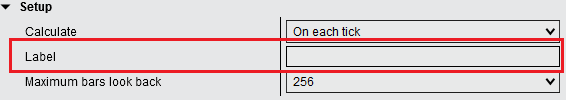
Remove indicators labels
Empty “Label” field in your indicator properties.
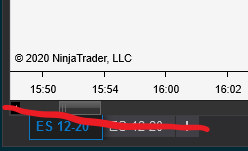
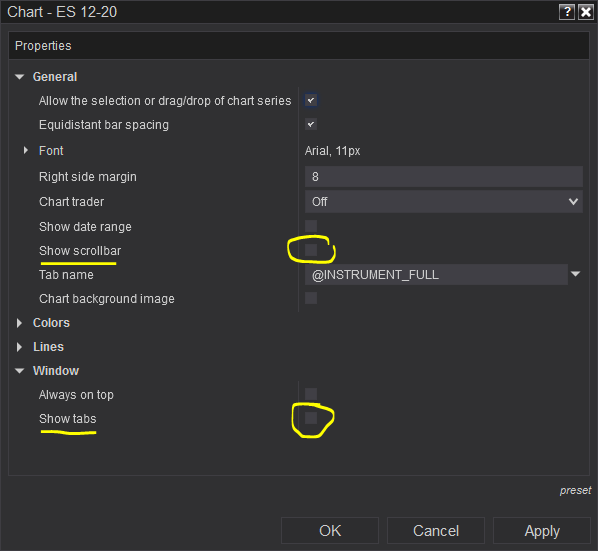
Remove tabs and scrollbar
If you don’t use tabs (multiple charts in same window) and/or bottom scrollbar, just hide them in your chart properties.
Remove useless drawing tools
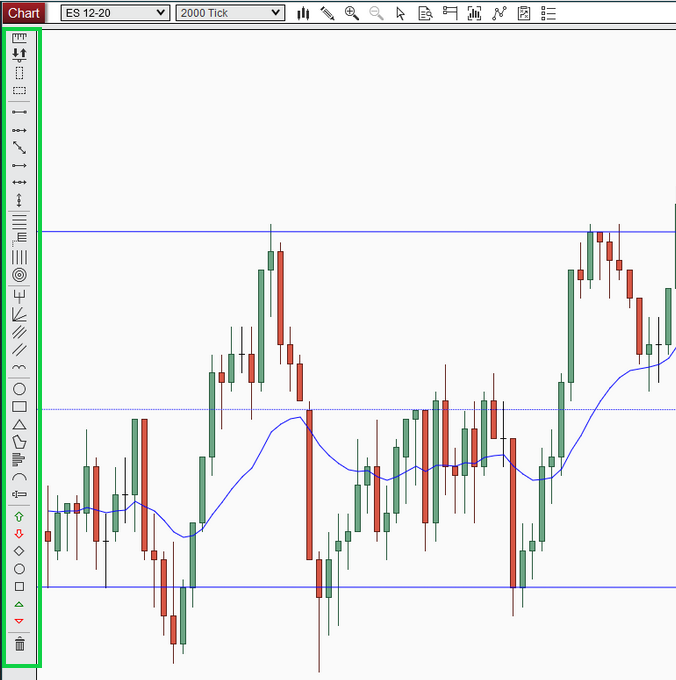
If you often draw on your chart (lines, channels, …) it might be a good idea to access these drawing tools easily.
A vertical toolbar as shown above can get the job done but:
- I never use some of these drawing tools
- It takes space on the left of my chart
So I decided to code my own horizontal toolbar where I can select which drawing tool to display.
It fits nicely inside the chart window toolbar.
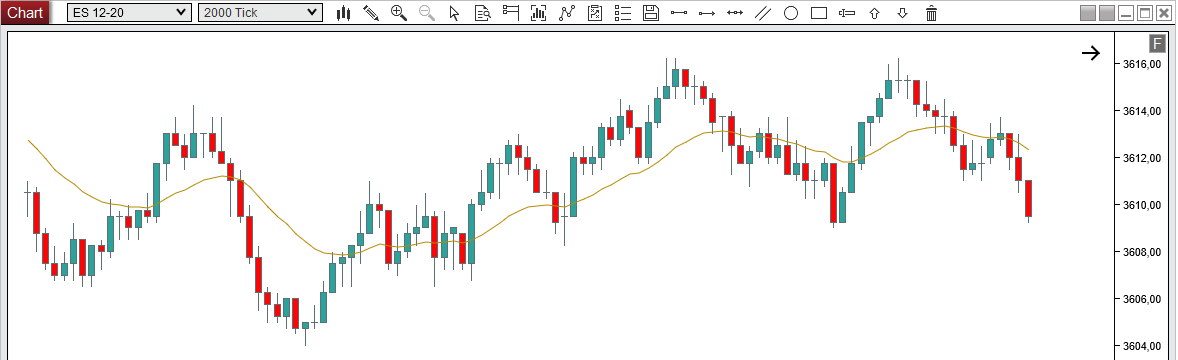
Now your chart looks cleaner, let’s make it even better!
Step 2: Ease your eyes
Light vs Dark Background
In people with normal vision (or corrected-to-normal vision), visual performance tends to be better with light mode, whereas some people with cataract and related disorders may perform better with dark mode. On the flip side, long-term reading in light mode may be associated with myopia.
https://www.nngroup.com/articles/dark-mode/
This is a personal choice. I went back and forth multiple times but always came back to a light background. I don’t use a pure white background for my charts. My eyes tend to prefer light grey background. Make sure to set your monitor brightness according to ambient light.
Candle Colors
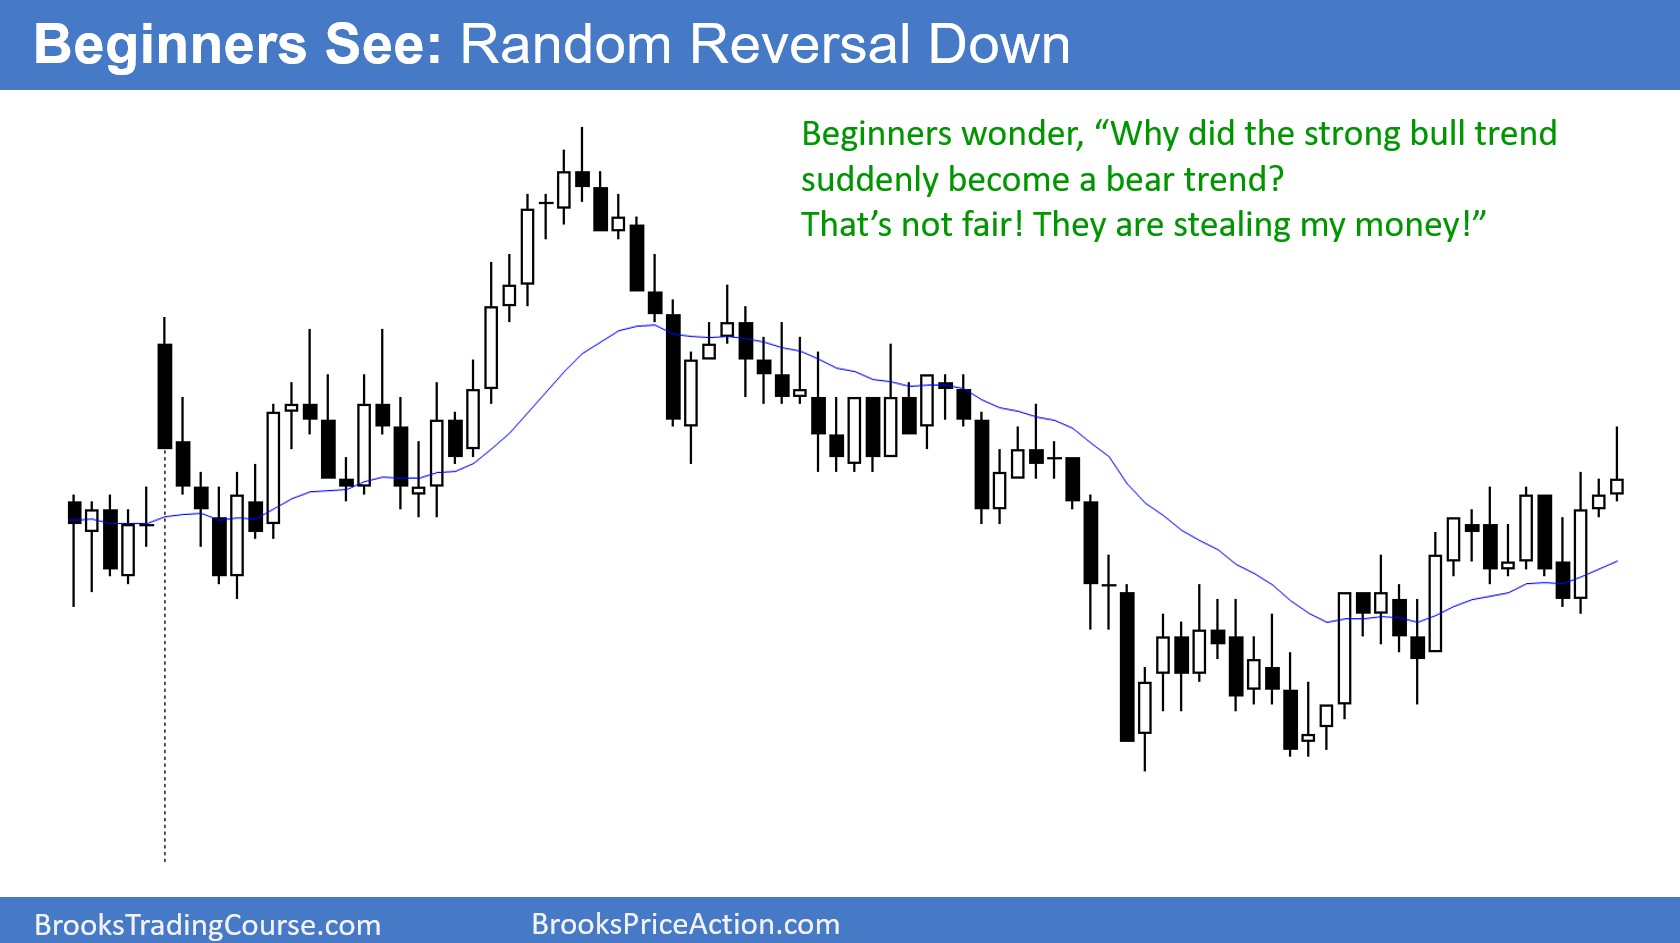
This default color scheme looks too contrasty for me:
- background:
White - up candle:
Green - down candle:
Red - ema:
Blue

I prefer this one (candles colors based on trading view white color style and modified to my needs):
- background:
WhiteSmoke - up candle:
#FF4A9B70 - down candle:
#FFEA431A - ema:
RoyalBlue

I also played around with Solarized Color Scheme. This is a popular color palette designed for use with terminal and gui applications. It has been tested extensively in real world use on color calibrated displays (as well as uncalibrated/intentionally miscalibrated displays) and in a variety of lighting conditions.
I really like it for my text editors but don’t know yet if it’s suitable for a trading chart.

It looks like this:
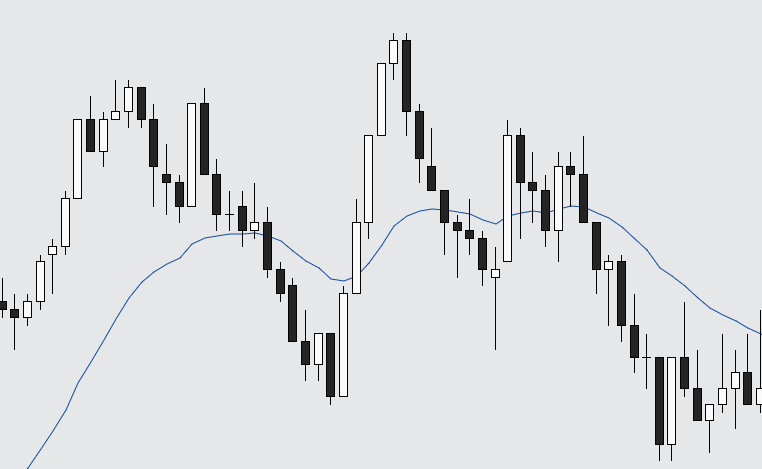
Finally I decided to remove candle red/green colors and went for a black and white color scheme. Colors can also be a distraction. Black and white look very neutral and calm to me, it’s also very constrasting so I can quickly see what is the current short term trend. I got inspired by Al Brook here. Note that I’m not using pure black nor pure white.
- background:
#FFE6E7E8 - up candle:
#FFFAFAFA - down candle:
#FF212121 - ema:
#FF0D47A1
Trading Platform Skin
Play around with your trading platform theme. NT8 has several skins (Tools → Options → General → Skin) and you can make your own (I made some here).
I finally decided to stay with “Slate Light” NT8 Skin, it’s good enough for me. I just made 2 small modifications: I removed the eye catching top left and top right red color.
To replicate this you have to go to C:\Users\<user>\Documents\NinjaTrader 8\templates\Skins
Then copy/paste your current skin folder and give it a new name.
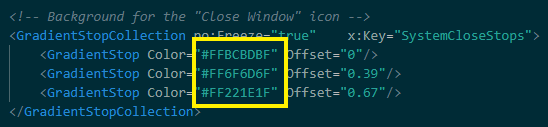
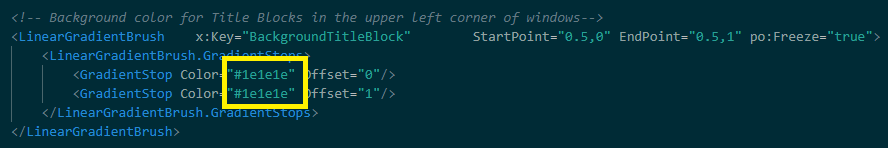
Then go to that folder and edit BluePrint.xaml
Search for Close Window and BackgroundTitleBlock and change colors to what you want.
Go to NT8 → Tools → Options → General → Skin and select your newly created skin. Restart NT8.
This is what my chart looks like now (click image to display it fullsize):
